Epidemiology of traumatic brain injury in the Republic of Korea from 2011 to 2014: based on three major data sources in the Republic of Korea
Article information
Abstract
Objective
Traumatic brain injury (TBI) is one of the leading causes of death and disability worldwide. In the Republic of Korea, TBI is one of the top 10 causes of death, which contributes about 3% of total mortality. However, there is limited research on TBI in the Republic of Korea. The objective of this study is to provide epidemiologic characteristics of TBI in the Republic of Korea using three different major nationwide data sources.
Methods
Three nationwide databases, National Emergency Department Information System (NEDIS), Emergency Department-based Injury In-depth Surveillance (EDIIS), and National Death Statistics of Korea were used to describe the epidemiologic characteristics of TBI in the Republic of Korea from 2011 to 2014. Using each data source, burden of TBI as regards to the age group, gender, injury mechanism, emergency department result, and deaths.
Results
Regardless of data source used, we found an increasing trend of TBI incidence in the Republic of Korea. Based NEDIS, more than 100,000 patients visit emergency department each year for TBI in the Republic of Korea and the numbers were increasing from 2011 (n=106,403) to 2014 (n=132,113). Regardless of the data source used, approximately 60% of TBI patients were males and occurred mostly in adults with aged between 15−64 years. Traffic accidents and fall were leading injury mechanisms of TBI as well as TBI deaths. According to National Death Statistics of Korea, nearly 4,000 people die due to TBI every year.
Conclusion
Our study provides the epidemiologic characteristics of TBI in the Republic of Korea. From a primary prevention perspective, our study results also highlight the need for programs focused specially for traffic accidents and fall-related injuries. Further research is needed for the prevention of TBI.
INTRODUCTION
Traumatic brain injury (TBI) is one of the leading causes of death and disability worldwide. As a major socioeconomic problem, TBI is prevalent in both low- and high-income countries and affects people of all ages [1]. According to the World Health Organization (WHO), TBI is predicted to surpass many diseases as a major cause of death and disability by 2020 [2]. In the United States alone, over 17 million people are diagnosed with TBI each year, of those about 275,000 people are hospitalized and survive, 124,000 people became chronically disabled, and about 52,000 people die of TBI [3]. However, despite its significant public health burden, there has been limited attention on TBI research, particularly in Asian countries. It was suggested that reliable quantification of the burden of TBI is difficult due to inadequate standardization and incomplete capture of data on TBI [4].
In the Republic of Korea, TBI is one of the top 10 causes of death, which contributes about 3% of total mortality [5]. Therefore, epidemiologic data on TBI is of great importance to prevent, to improve public health programs, to efficiently implement protocols of managing it, and to provide effective medical care and rehabilitation services for patients [6]. However, little attention has been paid to TBI research in the Republic of Korea. There are several surveillance data sources in the Republic of Korea, which can be used for epidemiologic studies of TBI in the Republic of Korea, including National Department Information System (NEDIS), Emergency Department-based Injury In-depth Surveillance (EDIIS), and Cause of Death Statistics in the Republic of Korea. The objective of this study is to provide epidemiologic characteristics of TBI in the Republic of Korea using three different major nationwide data sources.
METHODS
Ethics statement
Use of data in this study was approved by the Institutional Review Board (IRB) of Seoul National University Hospital through expedited review with the requirement for informed consent waived (IRB No: 2012-104-1183 for NEDIS and 2107-010-1231 for EDIIS).
Study setting
The Republic of Korea has a population of approximately 51 million people with a life expectancy of 82.3 years (78.8 for males and 85.5 for females) according to the 2015 WHO [7]. There are approximately 460 emergency departments (EDs) in the Republic of Korea, which are designated by the Ministry of Health and Welfare as levels 1 through 3 according to capacity and resource measures, including staffing, equipment, and size of the department [8]. Currently, there are 20 regional EDs (level 1), 120 local EDs (level 2), and about 300 emergency facilities (level 3) across the country. Level 1 EDs provide a high level of emergency care by emergency physicians and contain emergency intensive care units.
Data sources
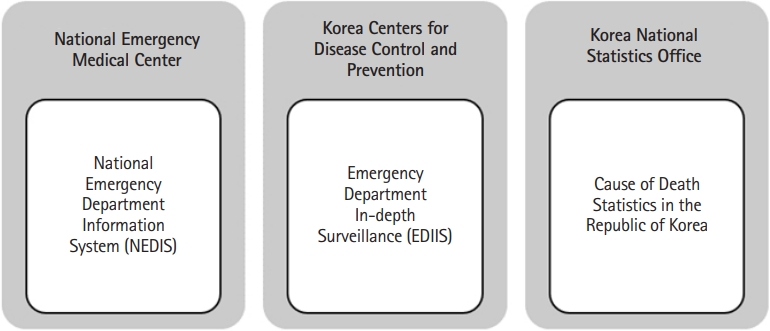
Three nationally representative data sources were used to describe the epidemiology of TBI in the Republic of Korea from 2011 to 2014 (Fig. 1).

Three different nationwide data sources were used in this study to describe the epidemiology of traumatic brain injury in the Republic of Korea from 2011 to 2014.
National Emergency Department Information System
NEDIS is a government-run, nationwide database for EDs across the Republic of Korea and is managed by the National Emergency Medical Center (NEMC), NEDIS has been in operation since 2003 and collected data from EDs across the nation. Major emergency centers electronically transfer their essential ED information to the NEMC. NEDIS collects data from patients who visit EDs and contains demographic and clinical information for patients. These data were qualified as accurate and the results are reported annually to the Ministry of Health and Welfare [9]. As of December 2016, 407 EDs across the Republic of Korea are participating in the NEDIS [10]. Data from 2011−2014 were used in this study.
Emergency Department-based Injury In-depth Surveillance
EDIIS is a nationwide, prospective database of injured patients visiting ED in the Republic of Korea, which was initiated to started in 2006 for gathering injury-related data for planning national policy for injury prevention [11]. Participating hospitals were sampled geographically by the Republic of Korea Centers for Disease Control and Prevention (KCDC). The EDIIS is designed based on the core data set of the WHO’s International Classification of External Causes of Injuries, and includes patients’ demographic, injury-related, prehospital, clinical, and outcome information [12]. Data collection is primarily done by general physicians and supervised by emergency medicine physicians, which is then entered by trained research coordinators into a web-based database system of the KCDC. The quality of data is regularly managed by a quality assurance team to maintain the quality of the data. Data from 2011 to 2014 were used in this study. During the study period of 2011−2014, 20 tertiary academic teaching hospitals participated in EDIIS. Currently, 23 hospitals across the Republic of Korea are participating EDIIS.
Cause of Death Statistics of the Republic of Korea
In the Republic of Korea, physicians are required to complete death certificates, which include information on the leading causes of death, antecedent causes and other major conditions contributing to death [13]. The death certificates are then sent to the Statistics Korea, where a professional staff identifies a single most relevant underlying cause of each death, according to the WHO definition. It has been reported that approximately 90% of all deaths were certified by 1987, and almost 100% of were certified by 2007 [14]. The causes of death are coded according to the Korean Classification of Diseases, 6th Revision, which is based on the International Classification of Diseases 10th Revision (ICD-10).
TBI case definition
TBI was defined on the basis of on ICD-10. Skull fracture (S02.0, S02.1, S02.7, and S02.8), intracranial injury (S06.1−S06.9), and concussion (S06.0) were included.
Data analysis
Frequency and proportions are presented. For types of TBI, individuals may have more than one type of TBI for TBI incidence. For TBI deaths, those who indicated having more than one TBI types, intracranial injury was considered as the primary cause of TBI deaths among those who indicated having intracranial injury and other TBI types, for those who indicated having skull fracture and concussion, skull fracture was considered as the primary cause of TBI death. All the descriptive statistics were calculated using SAS ver. 9.4 (SAS Institute, Cary, NC, USA).
RESULTS
National Emergency Department Information System
Demographic and injury characteristics
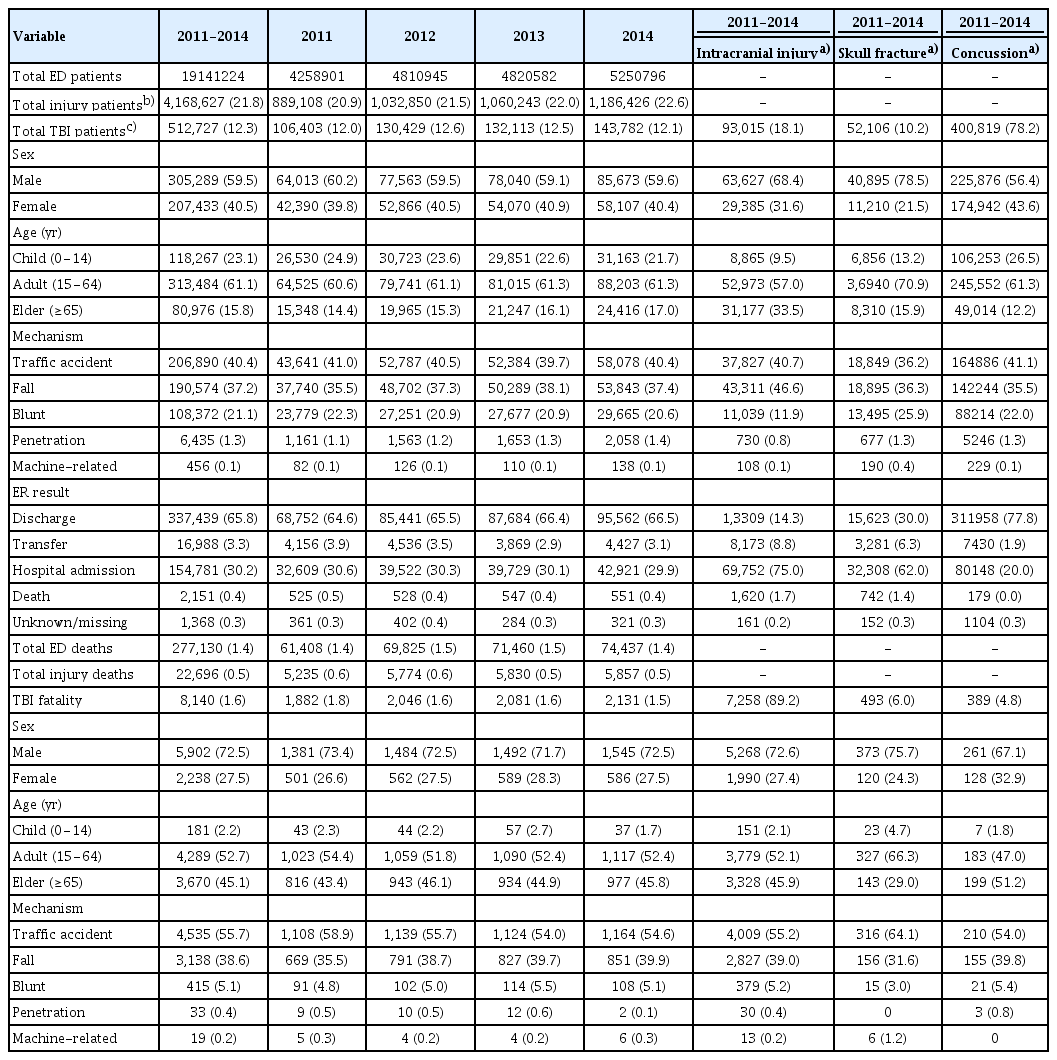
Table 1 shows the epidemiology of TBI based on NEDIS. During the study period, more than 19 million patients visited EDs across the Republic of Korea. From 2011 to 2014, the total number of ED patients increased from 4.26 million in 2011, 4.81 million in 2012, 4.82 million in 2013, and over 5.25 million in 2014. Of total ED patients, approximately 22% were injury patients. From 2011 to 2014, the proportion of injury patients from total ED patients slightly increased from 20.9% in 2011 to 22.6% in 2014. About 2.7% of total ED patients were TBI patients. From 2011 to 2012, the proportion of TBI patients increased from 2.5% to 2.7%, but remained in 2.7% at both 2013 and 2014. Of total TBI, about 18% were intracranial injury patients, 10% were skull fracture patients, and 78% were concussion patients.

Epidemiology of traumatic brain injury from 2011−2014, National Emergency Department Information System
Approximately 60% of total TBI patients were male. For intracranial injuries and skull fracture, 68.4% and 78.5% were male patients, respectively. Most TBI occurred in adults. During the study period, over 61% of the total TBI patients were in the age group of 15−64 years old. While 9.5% and 13.2% of intracranial and skull fracture injuries occurred in the age group of children under 15, 26.5% of concussion occurred in this age group.
Based on the NEDIS data, approximately 40% of all TBI were a result of traffic accidents. However, from 2011 to 2014, a slightly decreasing trend of traffic accident-related TBI was observed (41.0% in 2011 to 39.7% in 2014). Most prevalent injury mechanisms for each type of TBI were fall (46.6%) for intracranial injury, both traffic accident and fall (36.2% and 36.3%, respectively) for skull fracture, and traffic accidents (41.1%) for concussion.
Results in emergency department
During the study period, more than 65% of total TBI patients were discharged from the ED. Hospital admission was observed in 30.2% of the patients and 3.3% patients were transferred to other hospitals and about 0.4% of the patients died in ED. Only 14.3% of the total intracranial injured patients were discharged the ED, 75% were admitted to hospital, and 1.7% died the ED. Patients with concussion had the highest ED discharge rate (77.8%), but 20% of patients with concussion were still hospitalized.
TBI fatality
During the study period, overall ED fatality was shown to be approximately 1.4%. Compared with the overall ED injury-related fatality of 0.5%, overall TBI fatality was 1.6%, which is approximately 2,000 deaths each year. A decreasing trend of TBI fatality was observed from 2011 to 2014 with fatality rate of 1.8% and 1.5%, respectively. Of total 8,140 TBI deaths, 89.2% were from intracranial injury, 6.0% from skull fracture, and 4.8% from concussion. Overall, males had higher TBI fatality rates than females (72.5% vs. 27.5%). Approximately 2.2% of TBI fatality occurred in children and over 52.7% occurred in the adult group. Traffic accidents were the mechanism of TBI deaths (55.7%) followed by a fall (38.6%).
Emergency Department Injury In-depth Surveillance
Demographic and injury characteristics
Table 2 shows the epidemiology of TBI based on EDIIS. Similar results were observed using EDIIS data. During the study period, 983,846 injury patients visited 20 participating EDs across the nation. Both injury and TBI patients increased from 225,029 in 2011 to 259,752 in 2014. Overall, 9% of the total ED visiting injury patients were TBI patients. From 2011 to 2013, the TBI patients increased from 8.9% to 9.6% of the total injury patients, but slightly decreased in 2014 (9.1%). Of total TBI patients included in EDIIS, about 62.4% were male and majority were adults of age 15−64 years (56.6%). The leading mechanisms of TBI were fall (46.7%) followed by traffic accident (33.3%) and blunt (19.2%). Majority of TBI injuries were unintentional (92.0%), but about 7.2% TBI injuries were due to violence and/or homicide. About 56% of all TBI occurred in public with higher rates of occurrence in public places for intracranial injury (62.8%). Approximately 40% of TBI injuries occurred during daily activity followed by leisure (29.4%) and work (16.4%).
Results in emergency department
While over 67% of TBI patients were discharged in general, only 11% of intracranial injured patients and 44% of skull fracture patients were discharged. The overall ER mortality rate was 1.3% with the highest in intracranial injury (4.3%).
TBI fatality
Based on EDIIS, total injury fatality rate was 9.1% with a decreasing trend from 2011 (10.1%) to 2014 (8.1%). Overall TBI fatality was 3.0% with also a decreasing trend from 2011 (3.5%) to 2014 (2.6%). Of the total 2,727 TBI deaths, 85.0% were from intracranial injury deaths, 10.5% from skull fracture deaths, and 4.5% from concussion deaths. Of the total TBI deaths, more than 70% were male patients. 55.6% were in the age of 15−64 years and 40.5% from the age group of greater than 65 years. Traffic accident was the major cause of TBI deaths (58.5%) followed by a fall (37.3%). Most of the TBI deaths were unintentional (91.5%) and occurred in public places (72.5%).
Death Statistics of the Republic of Korea
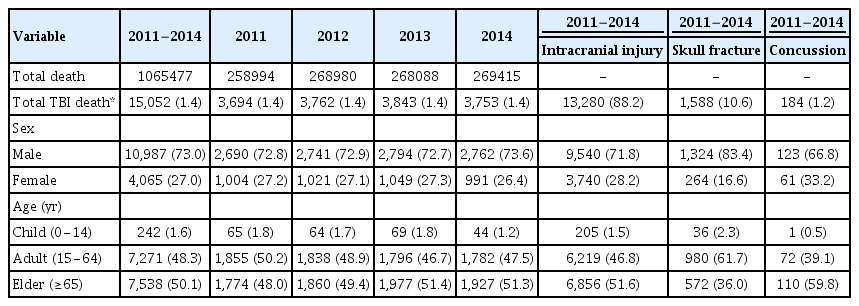
Table 3 shows the TBI death statistics in the Republic of Korea from 2011 to 2014. Over the 4-year period, 15,052 deaths were TBI-related deaths with the majority of them being intracranial injury death (n=13,280). Over 73% of TBI deaths occurred in male and majority of them were elders (50.1%) or adults with aged of 15−64 years (48.3%). However, skull fracture deaths occurred more in the adults with aged of 15−64 years (61.7%).
DISCUSSION
TBI is one of the most rapidly increasing cause of death and disability worldwide. Despite its significant health and socioeconomic burden, traumatic brain injury has been largely neglected. There have been only several previous studies on TBI in the Republic of Korea [15,16], of which none of them used nationwide data. The present study describes trends in the burden of TBI as regards to incidence, demographic, injury, and outcome characteristics, and deaths in the Republic of Korea over a four-year period from 2011−2014 using three nationwide databases.
Regardless of the data source used, we found an increasing trend of TBI incidence in the Republic of Korea. Patterns of TBI by age, sex, and mechanism of injury identified in this study were consistent with previous studies from other countries. TBIs presenting to EDs were known to occur disproportionately among males [17,18]. Traffic accidents and falls were most common mechanisms of TBI treated in the EDs [19,20]. Based on our study, in the Republic of Korea, males underwent 1.5 times as many TBIs as females do and have about twice higher risk of death from TBI. About a quarter of all TBIs occurred in children of age less than 15. Previous studies also reported TBI as one of the most common injuries associated with disability and a leading cause of non-fatal injury in children [16,21]. Our data reinforce the need for injury prevention efforts focused on these high-risk groups.
While both NEDIS and EDIIS provided similar epidemiologic characteristics of TBI, for injury mechanism, based on NEDIS data, traffic accident was the leading injury mechanism of TBI incidence, while fall was the leading injury mechanism for incidence of TBI, based on EDIIS. This difference might be due to the different numbers of EDs participating in NEDIS and EDIIS. While most of the secondary and tertiary hospital EDs participated in NEDIS, only 20 tertiary hospitals were participated in EDIIS during the study period, which is one of the limitations of this study. Slight differences in demographic factors of the included patients were observed between NEDIS and EDIIS. Compared with TBI patients included in NEDIS, there were more male (62.4% vs. 59.5%) and elderly patients over 65 years of age (17.3% vs. 15.8%) in EDIIS, which may have contributed observed slight difference in the leading injury mechanism of TBI. Although EDIIS data do not represent the total number of injury cases in the Republic of Korea, since EDIIS is an injury surveillance database, EDIIS collects injury-related data in depth, thus providing more injury-related information, such as intention and place of injury, and activity at the time of injury, which are information that is not provided by NEDIS.
Based on our data, while the number of TBI patients were continuously increasing, there was a slight decrease or unchanged rate of TBI deaths during the study period. This may be attributable to the advancement of medical treatments and enforced legislative laws, such as wearing protective helmets, car seats and seat belts. A recently published study reported that the rate of child car seat use increased from 12.5% in 2010 to 33.9% in 2016. However, traffic accidents are still the leading cause of TBI deaths in the Republic of Korea, thus more preventive interventions are needed to prevent TBI deaths from traffic accidents [22].
In conclusion, our study provides the epidemiologic characteristics of TBI in the Republic of Korea. From a primary prevention perspective, our study results also highlight the need for programs focused specially for traffic accidents and fall-related injuries. Further research is needed for the prevention of TBI.
Notes
CONFLICT OF INTEREST
No potential conflict of interest relevant to this article was reported.


