


INTRODUCTION
According to a 2013 report by the Fire and Disaster Management Agency of the Ministry of Internal Affairs and Communications on the state of emergency services in Japan, both the number of emergency calls and the number of people transported to hospitals in Japan reached a record high during 2012, while the number of emergency calls was approximately 27% higher than 10 years prior [1]. Furthermore, Japan's rapidly aging population is likely to lead to an increased demand for emergency medical services. As the volume of emergency calls grows, both the time it takes to reach an emergency scene and the time to arrive at a hospital are expected to increase annually [1]. In response to these challenges, the Fire and Disaster Management Agency has suggested strategies that include "collaboration between fire departments and medical institutions, as well as the enhancement of emergency services using information and communication technology" [2]. In line with these recommendations, several local governments have already started to implement the use of tablet-type devices and communication terminals (hereafter referred to as "tablets") [1].
In 2013, the percentage of patients who requested an ambulance required four or more hospital inquiries in Saitama Prefecture was 9.4%—higher than the national average of 3.4% and the second-worst rate in Japan. Additionally, the rate of first responders spending 30 minutes or longer at the scene of an emergency in the same prefecture was 16.8%, exceeding the national average of 5.4% and constituting the worst rate in Japan [3].
In 2013, after reviewing strategies to prevent the recurrence of ambulance diversion, Saitama Prefecture announced plans to create an emergency medical information system [4]. In April 2014, the Saitama Prefecture Emergency Medical Information System was launched, and all 283 ambulances among the 28 fire departments in Saitama Prefecture were equipped with tablets [4]. This system was established to link the prefectural government, medical institutions in the prefecture, and fire departments via the internet and to interconnect the medical institutions and fire departments [5].
It has been reported that the coronavirus disease 2019 (COVID-19) pandemic, which began in 2020, led to a record number of difficult emergency transport cases in Japan, occurring periodically until 2022 [6]. This surge was due to the rapid increase in the number of people with this infectious disease, which made the emergency medical system more fragile and consequently increased the number of difficult emergency transport cases.
The purpose of this study was to examine whether the introduction of tablets and smartphones at emergency scenes in Saitama City reduced the occurrence of difficult emergency transport cases and time spent at the scene. Furthermore, we aimed to examine the impact of the COVID-19 pandemic, which began after the introduction of these tablets and smartphones, on emergency transport operations.
METHODS
Data collection
We analyzed emergency statistics data (provided as Microsoft Excel files) for the period 2013 to 2021 compiled and maintained by the Saitama City Fire Bureau (internal report, February, 18, 2022). The Saitama City Fire Bureau granted permission to use these data. Data on emergency transport cases, excluding those where patients were not transported or were transferred between hospitals, were included. Additionally, permission to include the Saitama Prefecture Emergency Medical Information System in the current study was obtained from Kokusai Kogyo Co., Ltd., the developer of the system. The Institutional Review Board of the Graduate School of University approved this study (approval No. 22007). Written informed consent was waived.
Research subjects
The study utilized data collected by the Saitama City Fire Bureau for the years 2013 (47,745 cases), 2014 (48,611 cases), 2015 (49,390 cases), 2016 (52,718 cases), 2017 (54,556 cases), 2018 (56,696 cases), 2019 (56,391 cases), 2020 (50,269 cases), and 2021 (52,608 cases). The data included emergency transport cases, with the exclusion of those where patients were not transported or were transferred between hospitals.
Research design and statistical analysis
An interrupted time-series design was used to analyze the effects of the COVID-19 pandemic and the introduction of tablets and smartphones. The date of awareness of the emergency was established as the intervention assignment variable, with the following cutoff points: (1) April 2014, (2) March 2017, and (3) March 2020. Interrupted time-series analysis was performed with the RDD tools package in R software (R Foundation for Statistical Computing).
Continuous variables were described using means and standard deviations, while categorical variables were described using frequencies of observations (%). Significance levels for tests were defined as P<0.05 or 95% confidence intervals (CIs). In this case, we used the risk difference rather than the odds ratio. In other words, the significance level at 5% is whether the 95% CI exceeds or does not exceed 0. Interrupted time-series designs are known to enable effect estimation similar to randomized controlled trials, provided that certain assumptions are fulfilled [7,8]. The mechanism by which the analysis enables an effect estimation similar to that of a randomized controlled trial is straightforward: If no other interventions occur at the time of the cutoffs during the observation period, it is reasonable to assume that the patient groups just before and after the threshold are comparable with respect to all variables except those influenced by the intervention. Then, if the background characteristics of the two groups are similar, the difference in outcomes for the two groups will be similar to the effect measured by a randomized controlled trial. The interrupted time-series design leverages this concept to obtain a regression equation for the periods before and after the cutoff, as well as to estimate the effect of the intervention based on the amount of change at that cutoff [9].
The three assumptions underpinning this analysis are (1) clear assignment rules and cutoffs, (2) no arbitrary manipulation of the assignment variables, and (3) no effects of the assignment variables on factors related to the endpoints [9]. We checked the validity of these assumptions as follows: Regarding assumption 1, within the Saitama City Fire Bureau, cases were handled according to time of awareness (i.e., assignment rules), and it was widely known that tablets were introduced in April 2014 (i.e., a cutoff) and smartphones in March 2017 (i.e., a cutoff). Additionally, in March 2020, the World Health Organization declared COVID-19 a pandemic because of the global spread of infected individuals (i.e., a cutoff). Therefore, assumption 1 was considered to have been fulfilled. Regarding assumption 2, the time of emergency calls is recorded electronically, making it effectively impossible to arbitrarily manipulate the assignment variable; thus, assumption 2 was considered to have been met. Finally, an interrupted time-series design was used to evaluate assumption 3, no effects of the assignment variable on factors related to the endpoints; for all variables, no significant discontinuities were identified from before to after the cutoffs, and continuity was demonstrated around the cutoffs (Table 1).
Functions of the system used in Saitama Prefecture
Saitama Prefecture shares its southern border with Tokyo Prefecture and spans approximately 103 km from east to west and 52 km from north to south. With a population of approximately 7.34 million people [10], the prefecture’s capital, Saitama City, is situated in the southeastern part. As a designated city, it has a population of approximately 1.34 million [11]. In 2012, the average time taken from emergency calls to hospital acceptance in Saitama City was 43.9 minutes, which significantly exceeded the national average of 38.7 minutes (internal report, April, 1, 2013). In 2011, Saitama Prefecture was projected to have the nation’s highest increase in the aging rate by 2035 [12]. However, in 2013, the number of physicians per 100,000 people and the number of hospital beds in Saitama Prefecture were the lowest in Japan [13]. Considering these issues, the Governor of Saitama Prefecture stated in 2014 that the Saitama Prefecture Emergency Medical Information System’s goal was to reduce the number of hospital inquiries (particularly in cases in which a single patient requires four or more inquiries) by 30% compared with 2013 [14].
System functions
The following functions have been implemented in the system.
Medical institution information-sharing
This function assists in the selection of medical institutions that meet the implementation criteria by confirming, on the terminal, the availability of information (demand information) that medical institutions input into emergency medical information systems.
Transport record information-sharing
This function supports the selection of medical institutions by sharing information on transport records (e.g., transport time and acceptance/rejection) entered by the emergency medical team of each medical institution.
Injured/ill person information-sharing
This function allows the emergency medical team and the medical institution to share information, entered by the emergency medical team, regarding the injured/ill person (including image transmission), thereby assisting the medical institution in establishing an acceptance system.
Emergency assessment support
This function supports the assessment of the degree of urgency by allowing the emergency medical team to enter vital signs and other information obtained through observation of the injured/ill person in the terminal.
Information output function (e.g., reporting system)
This function outputs information (e.g., emergency activity records and statistical data) entered by the emergency medical team during dispatch. This serves to reduce the administrative burden on emergency medical team members after they return to the station and supports operation efficiency.
Activity record analysis
This function improves the quality of emergency medical team activities by comparing and analyzing the activity record data entered by the emergency medical team with the data from the initial medical examination (i.e., after the physician takes over the case from the emergency medical team, he or she provides an initial medical examination and diagnosis and signs the emergency paperwork).
System specifications
Kokusai Kogyo designed the Medical Facilities Information System for municipalities, fire departments, and medical institutions, primarily focusing on information sharing within medical institutions and facilitating transport record sharing. These functions were custom-tailored to meet the specific needs of Saitama Prefecture [15]. In this system, when an ambulance team uses a tablet with internet access (e.g., a 4G connection provided by a major cell phone company) to select an item that matches the symptoms or observation status of an injured or sick person, the available hospitals are instantly displayed on the tablet in order of proximity to the location of the ambulance based on its GPS location. The ambulance team inquires with the hospital according to the above results and then determines the hospital to which the patient will be transported. After the hospital accepts the patient, the fire department enters information on the actual transport results, including the receiving institution, reason for selection, and transport time.
As of February 2023, the system has been introduced in nine municipalities in prefectures such as Saitama and Saga, which have been using the system since April 2011. Saga Prefecture has reported a reduction in emergency transport times and the number of hospital inquiries [16].
Outcome measures were based on the impact of the introduction of tablets, smartphones, and the effect of COVID-19 pandemic on the time spent on site, time spent on site of 30 minutes or more, and the number of cases with four or more hospital inquiries. The Fire and Disaster Management Agency of the Ministry of Internal Affairs and Communications defines a “difficult emergency transport case” as a situation where medical institutions are contacted four or more times to check if they can accept the patient, and/or when a destination is not decided within 30 minutes or more after arrival at the scene [3]. This concept is equivalent to what is commonly referred to as “ambulance diversion” in emergency scenarios.
RESULTS
The study utilized data collected by the Saitama City Fire Bureau for the years 2013 (47,745 cases), 2014 (48,611 cases), 2015 (49,390 cases), 2016 (52,718 cases), 2017 (54,556 cases), 2018 (56,696 cases), 2019 (56,391 cases), 2020 (50,269 cases), and 2021 (52,608 cases). Patients’ basic characteristics are shown in Table 2.
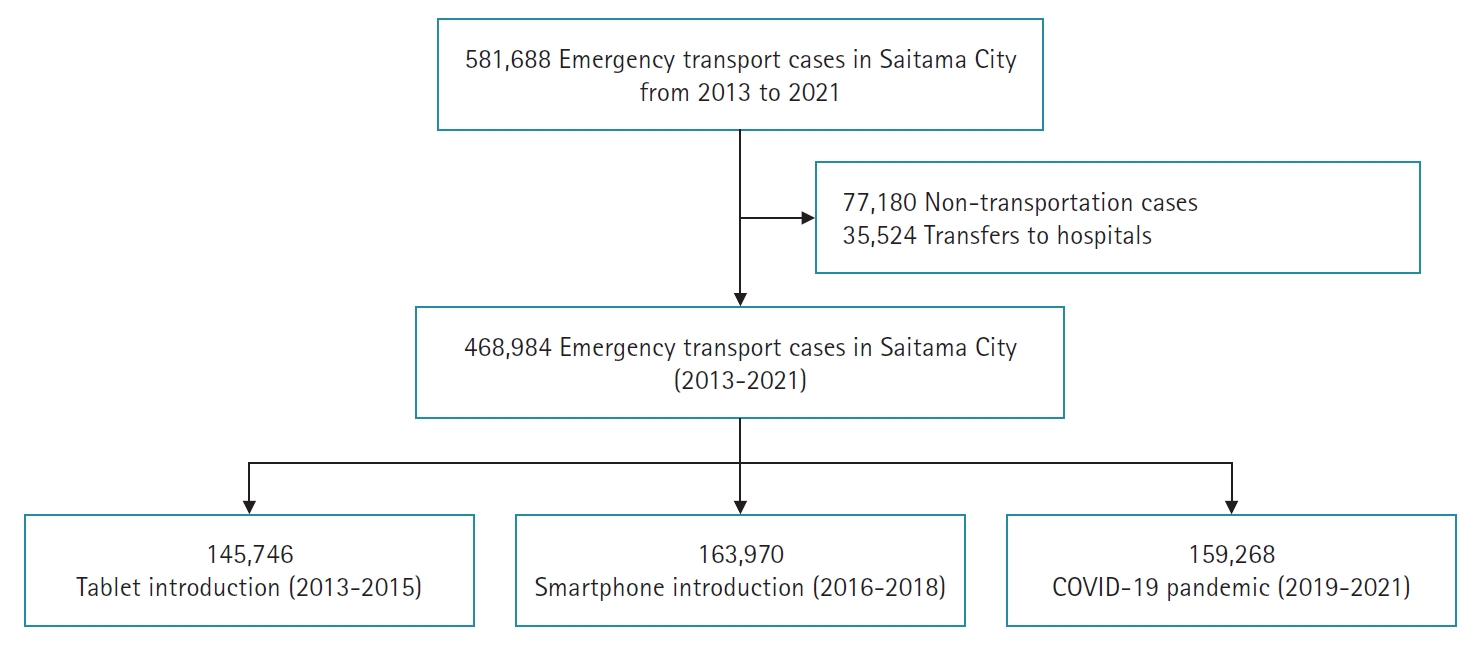
To examine the effectiveness of tablets, which were introduced in April 2014, after excluding 24,481 non-transports and 11,391 transfers, we included 145,746 of the 181,618 emergency transport cases from 2013, 2014, and 2015. To examine the effectiveness of smartphones, which were introduced in March 2017, after excluding 25,409 non-transports and 12,302 transfers, we included 163,970 of the 201,681 emergency transport cases from 2016, 2017, and 2018. To examine the impact of the COVID-19 pandemic on emergency transport status, after excluding 27,290 non-transports and 11,831 transfers, we included 159,268 of the 198,389 emergency transport cases from 2019, 2020, and 2021 (Fig. 1). There were no missing values in any year’s data. Additionally, in the analysis of tablet and smartphone adoption, autocorrelation was controlled by including seasonality into the study (Table 3 and Figs. 2, 3). No autocorrelation was observed during the COVID-19 pandemic. However, we did not conduct extensive analyses that accounted for seasonality, as doing so might have compromised the accuracy of the model (Table 3, Fig. 4).
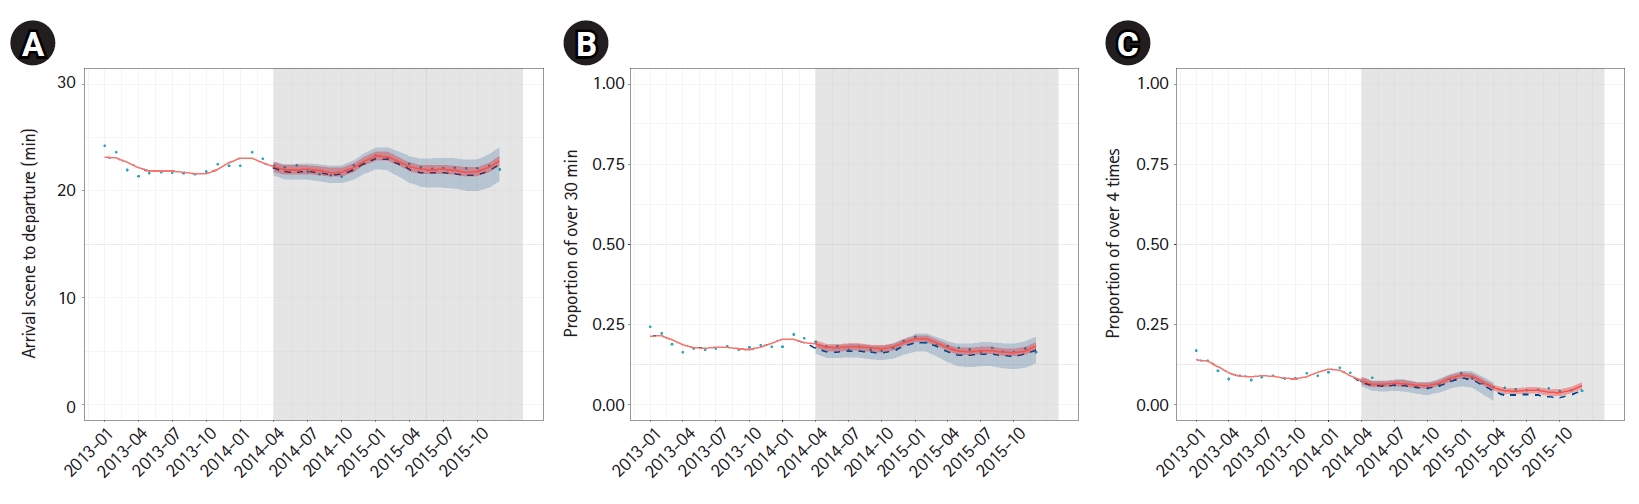
Effects of the introduction of tablets
Fig. 2 and Table 3 show the estimated changes in time spent at the scene, the number of cases wherein the time spent at the scene was 30 minutes or longer, and the number of cases requiring four or more hospital inquiries following the introduction of tablets. The intercept (intercept change: 0.16 [95% CI, –0.52 to 0.83], P=0.600) and slope (slope change: 0.01 [95% CI, –0.06 to 0.07], P=0.800) of the regression line for time spent at the scene did not differ significantly before and after the introduction of tablets. The intercept (intercept change: 0.01 [95% CI, 0.00 to 0.03], P=0.140) and slope (slope change: 0.00 [95% CI, 0.00 to 0.00], P>0.900) of the regression line for cases of 30 minutes or more spent at the scene did not differ significantly before and after the introduction of tablets. The intercept (intercept change: 0.00 [95% CI, –0.01 to 0.02], P=0.500) and slope (slope change: 0.00 [95% CI, 0.00 to 0.00], P=0.500) of the regression line for cases of four or more hospital inquiries did not differ significantly before and after the introduction of tablets.
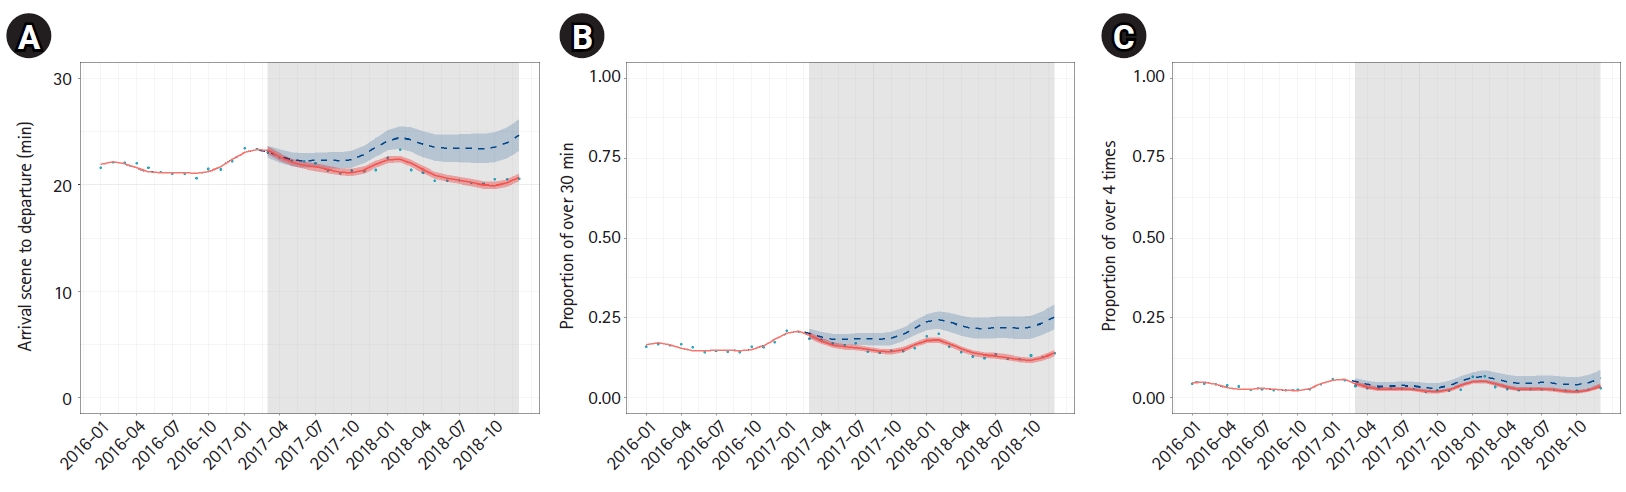
Effects of the introduction of smartphones
Estimated changes after the introduction of smartphones in time spent at the scene, cases of 30 minutes or more spent at the scene, and cases of four or more hospital inquiries are shown in Fig. 3 and Table 3. The intercept (intercept change: 0.14 [95% CI, –0.44 to 0.72], P=0.600) and slope (slope change: –0.20 [95% CI, –0.25 to –0.14], P<0.001) of the regression line for time spent on the scene differed significantly before and after the introduction of smartphones. The intercept (intercept change: –0.01 [95% CI, –0.02 to 0.01], P=0.300) and slope (slope change: –0.01 [95% CI, –0.01 to 0.00], P<0.001) of the regression line for cases of 30 minutes or more spent at the scene did not differ significantly before and after the introduction of smartphones. The intercept (change in intercept –0.01 [95% CI, –0.02 to 0.00], P=0.200) and slope (change in slope 0.00 [95% CI, 0.00 to 0.00], P=0.140) of the regression line for cases of four or more hospital inquiries did not differ significantly before and after the introduction of smartphones.
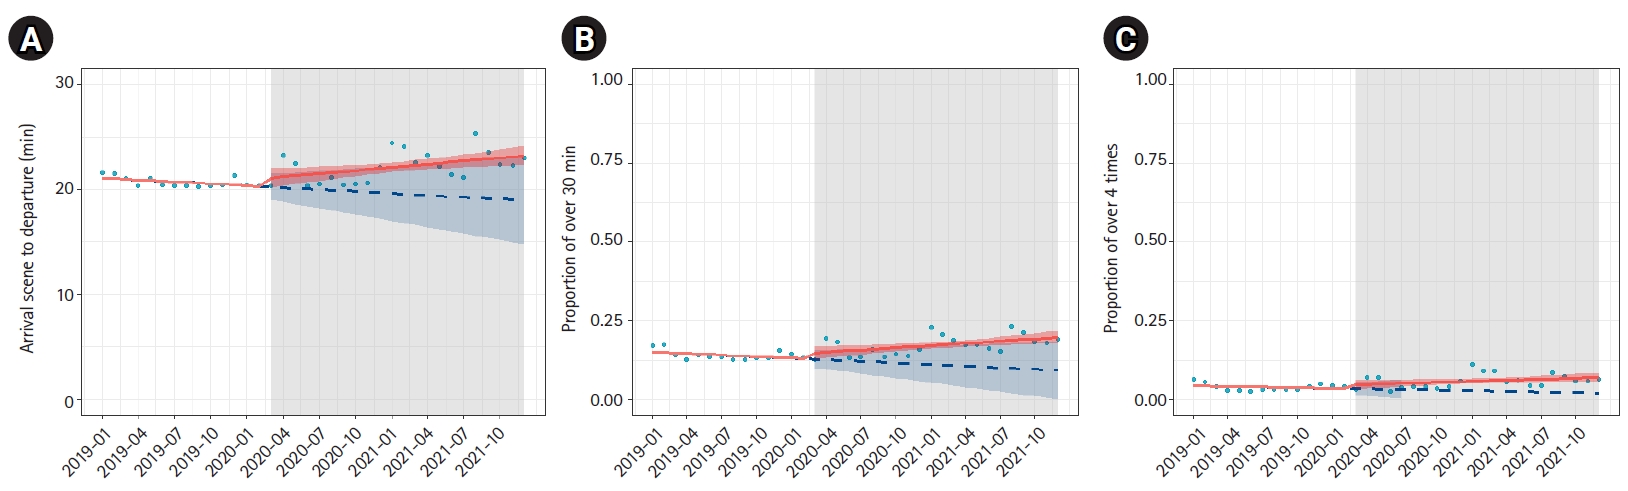
Effects of the COVID-19 pandemic
The estimated changes in time spent at the scene, cases of 30 minutes or more spent at the scene, and cases of four or more hospital inquiries due to the COVID-19 pandemic are shown in Fig. 4 and Table 3. The intercept (intercept change: 0.69 [95% CI, –0.78 to 2.20], P=0.300) and slope (slope change: 0.16 [95% CI, 0.00 to 0.33], P=0.050) of the regression line for time spent at the scene did not differ significantly before and after the declaration of the pandemic. The intercept (intercept change: 0.02 [95% CI, –0.02 to 0.05], P=0.300) and slope (slope change: 0.00 [95% CI, 0.00 to 0.01], P=0.028) of the regression line for cases of 30 minutes or more spent at the scene did not differ significantly before and after the declaration of the pandemic. The intercept (intercept change: 0.01 [95% CI, –0.01 to 0.04], P=0.400) and slope (slope change: 0.00 [95% CI, 0.00 to 0.00], P=0.200) of the regression line for cases of four or more hospital inquiries did not differ significantly before and after the declaration of the pandemic.
DISCUSSION
Randomized controlled trials involving pre-hospital care systems face many ethical barriers. An interrupted time-series design is thought to allow causal inference equivalent to that of a randomized controlled trial when certain assumptions are fulfilled [7,8]. The strength of our study is that it used such a design to estimate the effects of several changes.
When we compared first responders’ time spent at emergency scenes from July to October in 2013 and 2014 (before and after the introduction of tablets), we found a significant difference (P<0.05) between the mean of 21.68 minutes in 2013 and that of 21.41 minutes during the same period in 2014, as well as a decrease in the number of cases of four or more hospital inquiries during the same period. The year-on-year decrease was reported to be 31.4% [17]. Kiyota et al. [18] reported similar improvements using data for the whole of Saitama Prefecture; notably, the percentage of four or more hospital referrals (severe or more severe) and the percentage of on-site stays of 30 minutes or more (severe or more severe) in Saitama Prefecture have decreased significantly since the introduction of the system (P<0.010).
In this study, the introduction of tablets did not significantly improve the number of difficult emergency transport cases or time spent at the scene (Table 3). This was probably owing to our study’s interrupted time-series design with an observation period of three years as opposed to monthly comparisons for a single year.
However, a significant reduction in time spent at the scene was observed with the introduction of smartphones (Table 3). This improvement is likely because the hospital search screen displayed on the tablet device was simplified for smartphones, allowing smartphone users to easily search for hospitals and make inquiries; there was also no other difference between the applications or reporting systems used in smartphones and tablets, and smartphones can be regarded as being more convenient than tablets. This collection of factors may have supported the reduction in time spent at the scene observed in the findings. Specifically, before the introduction of smartphones, emergency medical teams searched for the appropriate medical institution on tablets and contacted the hospital using a 3G mobile phone rather than a smartphone.
Although the COVID-19 pandemic resulted in an increase in difficult emergency transport cases and time spent at the scene, these effects were not significant (Table 3). The number of difficult emergency transport cases, including those associated with the COVID-19 pandemic, has been increasing in Saitama City since 2020 and reached a record high in each period until 2022 [6]. For example, reports from the Saitama City Fire Bureau for the period 2020 to 2022 show emergency cases that required 89 hospital referrals and 10 hours for the conclusion of transport. Despite this state of affairs, one possible reason for the lack of a significant increase in difficult emergency transport cases and time spent at the scene could be the fluctuations in the number of emergency dispatches between 2019 and 2022: 69,493 in 2019, 62,457 in 2020, 66,442 in 2021, and a record high of 80,365 in 2022. This suggests that the interrupted time-series design showed effects on the intercept change (which is a measure of rapid change) and the slope change (which is a measure of gradual change).
The chronic imbalance between the supply of medical care (e.g., the number of emergency medical facilities, beds, and physicians) and the demand for emergency medical care is expected to worsen as the number of emergency medical transports increases. The results of this study suggest that the capacity of medical supply relative to emergency demand has already reached its limit.
This study had several limitations. First, it was an observational study, which may have led to selection bias, information bias, and confounding factors. We attempted to minimize these issues by adopting a quasi-experimental design using data covering all cases under the jurisdiction of the Saitama City Fire Bureau and carefully checking the prerequisites of the interrupted time-series design. However, the presence of unmeasured confounding factors could not be completely ruled out, and they may have affected the results.
Second, autocorrelation bias may occur in an interrupted time-series study if the same persons are included before and after the cutoff. Although the number of cases that met the target condition multiple times during the observation period may be limited, the data set used does not identify individuals and does not address this bias. However, Bernal et al. [19] reported that “In many epidemiological data, autocorrelation is largely explained by other variables, in particular, seasonality; therefore, after controlling for these factors, residual autocorrelation is rarely a problem.” Since the present study used three years of emergency statistics data (from January to December of each year) for each phase, autocorrelation bias is unlikely to have occurred. However, we did find an autocorrelation between the introduction of tablets and the introduction of smartphones. We controlled for this autocorrelation by performing an analysis that took seasonality into account (Table 3, Figs. 2, 3). No autocorrelation was found for data on the COVID-19 pandemic (Table 3, Fig. 4).
In the future, as the number of injured and ill patients increases rapidly during infectious disease outbreaks and large-scale disasters, the emergency medical information system will need to be improved further. Additionally, with approximately 9 years having passed since the introduction of the system in Saitama Prefecture, the optimization and limitations of information and communication technology functions and emergency activities must be examined closely.