Video versus Macintosh laryngoscopes for prehospital tracheal intubation in Japan: a propensity score matching analysis
Article information

Abstract
Objective
In recent years, the efficacy of tracheal intubation for out-of-hospital cardiac arrest (OHCA) performed by emergency medical technicians has been a subject of considerable debate. This study aimed to compare the success rate, complication rate, return of spontaneous circulation (ROSC), neurological prognosis (cerebral performance categories 1-2 [CPC1-2]), and regional differences between the use of video laryngoscopes (VLs) and Macintosh laryngoscopes (MLs) in OHCA patients.
Methods
This retrospective cohort study utilized data from 10,067 OHCAs and emergency medical transports, extracted from national Utstein-style data and compared using propensity score matching. The primary endpoints were the success rate of tracheal intubation and the complication rate.
Results
In this study, 885 intubated OHCA patients were enrolled, and 664 were analyzed after propensity score matching. The success rate was significantly higher in the VL group (94.0%; 312/332) than in the ML group (89.8%; 298/332) (relative risk, 1.05; 95% confidence interval, 1.00–1.10; P=0.040). Esophageal intubation occurred in 0% (0/332) of the VL group and in 5.7% (19/332) of the ML group, reflecting a statistically significant difference (relative risk, 1.06; 95% confidence interval, 1.03–1.09; P<0.001). The ROSC and CPC1-2 rates were similar in both groups.
Conclusion
Our data suggest that VLs offer a slight advantage with a higher success rate and lower complication rate. Further discussion is warranted regarding the preferential use of VLs and the development of emergency medical services intubation devices.
INTRODUCTION
In Japan, emergency medical technicians (EMTs) have been authorized to intubate patients experiencing out-of-hospital cardiac arrest (OHCA) since 2004. Tracheal intubation is presently employed as one of the advanced airway management devices for OHCA patients. However, in recent years, opinions have greatly varied regarding the effectiveness of prehospital intubation in OHCA cases by emergency personnel.
Benoit et al. [1] reported that the odds ratio for ROSC was significantly higher in OHCA patients who underwent tracheal intubation compared to those who received supraglottic airway devices. This suggests that tracheal intubation may be beneficial. Conversely, Hirasawa [2] compared the survival rates of OHCA patients using supraglottic airway devices with those who were intubated. He concluded that tracheal intubation may decrease the survival rate of OHCA patients and that there is no medical evidence to suggest that tracheal intubation improves survival in OHCA. Additionally, some studies suggest that mask ventilation may result in better survival-to-discharge rates and neurological outcomes than tracheal intubation [3,4]. In light of this, the Consensus on Science with Treatment Recommendations 2020 (CoSTR2020) recommends the use of supraglottic airway devices or tracheal intubation for advanced airway clearance in emergency systems with a high success rate of tracheal intubation in OHCA. However, in emergency systems with a low success rate of tracheal intubation, the use of supraglottic airway devices for advanced airway clearance is suggested [5].
In 2010, a pilot study was carried out in Hiroshima Prefecture, Japan, to assess the effectiveness and safety of video laryngoscope (VL) use by EMTs for patients slated for surgery. The study confirmed a success rate of 97% [6]. Based on these results, tracheal intubation using a VL has been available since August 2011, and EMTs certified in VL use have been trained since 2012 [7].
Comparative studies of tracheal intubation using Macintosh laryngoscopes (MLs) and VLs include a report by a physician at a medical institution [8] and a study using a mannequin [9]. Comparative studies among prehospital EMTs have been reported in the United States [10] and Europe [11], but not in Japan.
Since 2012, we have been utilizing a VL (Airway Scope, Pentax) as our primary device for tracheal intubation. We have analyzed data from Hiroshima Prefecture, an area with a high rate of VL usage. We hypothesized that tracheal intubation using a VL could enhance the prognosis of patients experiencing OHCA.
The aim of this study was to compare the success rates, complication rates, rates of return of spontaneous circulation (ROSC), cerebral performance categories 1-2 (CPC1-2), and regional differences between the use of VLs and MLs. Additionally, we sought to evaluate the effectiveness of VLs.
METHODS
Study design
In this retrospective cohort study, we extracted data on tracheal intubation in Hiroshima Prefecture, utilizing the nationwide Utstein-style data from 2015 to 2019. Additionally, we incorporated emergency transport data and information from the Hiroshima Prefecture tracheal intubation verification form.
We sought and received approval to carry out this study from the Ethics Committee on Research Involving Human Subjects at Kokushikan University (approval number 21005). We fully informed the parties associated with the facilities supplying the materials in Hiroshima Prefecture and obtained their written consent. The data utilized in this study did not include any information that could identify specific facilities or individuals. We exercised due diligence to ensure the privacy of the data was adequately protected.
Target and extraction conditions
For this study, we amalgamated 5 years of nationwide Utstein-style data, comprising 627,982 cases, and emergency transport data, consisting of 26,710,481 cases, collected from January 1, 2015, to December 31, 2019. From this data, we identified cases of OHCA occurrence in Hiroshima Prefecture, totaling 10,067 cases. We then merged these OHCA cases in Hiroshima Prefecture with data from the Hiroshima Prefecture tracheal intubation verification form, which included 1,062 cases. After excluding 83 cases that did not combine, we were left with 979 cases. From these 979 cases of tracheal intubation in Hiroshima Prefecture, we further excluded: (1) cases with negative values for the time factor (31 cases); (2) cases with outliers for the time factor (58 cases); and (3) cases with multiple identical instances (5 cases). After these exclusions, we included 885 cases in our study (Fig. 1).

Definition of study cohort. OHCA, out-of-hospital cardiac arrest.
As of April 1, 2019, the Medical Control system in Hiroshima Prefecture, the target prefecture, is composed of seven regional medical control committees and 13 fire departments. There are 633 operational EMTs. Among these, 228 EMTs are certified in tracheal intubation and 170 EMTs are certified in video laryngoscopy. However, 405 EMTs, which constitute 64% of the total, are not certified in tracheal intubation. The advanced airway securing devices available include a glottis upper airway device (laryngeal mask, laryngeal tube) and a tracheal intubation tube. Paramedics who lack certification in tracheal intubation, representing 64% of the total, utilize supraglottic airway devices. Conversely, EMTs who are certified in tracheal intubation, making up 36% of the total, use a tracheal intubation tube. They attempt tracheal intubation and resort to using a supraglottic airway device if they encounter difficulties.
Study endpoints
The primary outcomes evaluated were the success rate of tracheal intubation and the rate of complications, specifically esophageal intubation. Secondary outcomes included the rate of ROSC and the presence of a CPC score of 1-2. The rate of good neurological prognosis at one month was defined by a CPC score of 1, indicating good function, or a CPC score of 2, indicating moderate impairment, according to the Glasgow-Pittsburgh Brain Function Categories.
Statistical analysis
Numerical data are expressed as the mean (standard deviation, SD). The Student t-test was used to compare continuous variables between each group. Qualitative data measures are presented as a percentage (number of cases). Both the Pearson chi-square test and Fisher exact test were employed for comparison, with a significance level set at 5%. The relative risk (RR) and 95% confidence interval (CI) were also calculated. Statistical analysis was performed using Microsoft Excel 2019 and JMP Pro 15.
Propensity score matching
To correct for potential confounding when comparing the VL and ML groups, we calculated propensity scores and performed 1:1 nearest neighbor matching (with a caliper of 0.1). To evaluate differences in confounders between the groups before and after matching, we calculated standardized mean differences (SMDs) based on the VL group. We considered values less than 0.1 as indicative of no significant group differences.
RESULTS
Patient characteristics
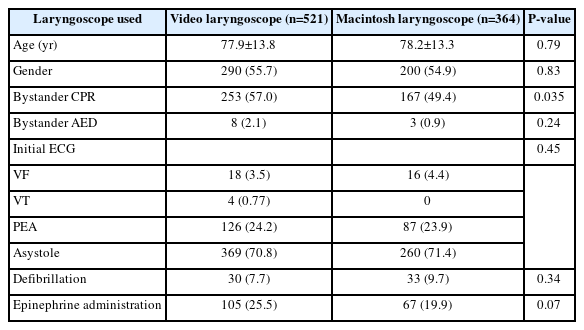
The characteristics of the patients in the study, who were either injured or ill, are presented in Table 1. Age, sex, bystander chest compressions, bystander automated external defibrillator (AED) use, waveform type, electroshock, and medication administration were analyzed. A significant difference was observed between groups regarding the presence or absence of bystander chest compressions (P=0.035). In terms of the initial electrocardiogram (ECG) waveform type, asystole was the most prevalent in both groups. It accounted for 70.8% (369/521) in the VL group and 71.4% (260/364) in the ML group.
Patients background
Characteristics of injured patients after propensity score matching
A multivariate logistic regression model was employed, using VL as the primary exposure and covariates as explanatory variables, to calculate the propensity score. The model's C statistic was 0.62, suggesting that propensity score matching should be applied.
Table 2 presents the characteristics of the injured patients included in this study, comparing the results before and after propensity score matching across the two groups.

Background of injured patients before and after propensity score matching
A total of 332 pairs were matched using propensity score matching. Factors such as the year of occurrence, day of the week (Saturday or Sunday), age, sex, location of occurrence, presence of witnesses, availability of verbal guidance, type of bystander, bystander chest compressions, bystander AED, initial ECG waveform, cardiogenic or noncardiogenic nature, presence of defibrillation, administration of drugs before intubation (specifically adrenaline administered by EMTs), and the time from the call to contact with the injured person (99th percentile) were all considered. All covariates had SMDs less than 0.1, indicating a well-balanced match between the two groups.
Success rates, complication rates, and time to perform tracheal intubation
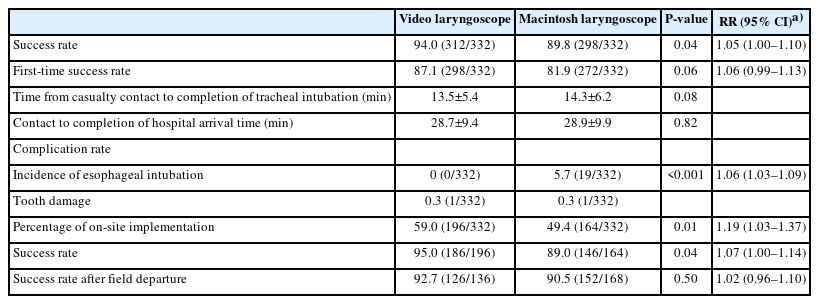
This study enrolled a total of 664 tracheally intubated OHCA patients. The success rate was 94.0% (312/332) in the VL group and 89.8% (298/332) in the ML group (RR, 1.05; 95% CI, 1.00–1.10; P=0.04). The first-time success rate was 87.1% (289/332) in the VL group and 81.9% (272/332) in the ML group (RR, 1.06; 95% CI, 0.99–1.13; P=0.060). The VL group demonstrated a significantly higher success rate than the ML group. Regarding complication rates, esophageal intubation occurred in 0% (0/332) of the VL group and in 5.7% (19/332) of the ML group, indicating a significantly higher complication rate in the ML group than in the VL group (RR, 1.06; 95% CI, 1.03–1.09; P<0.001). The mean time from initial contact with the injured individual to the completion of tracheal intubation was 13.5±5.4 minutes in the VL group and 14.3±6.2 minutes in the ML group. The mean time from initial contact with the injured individual to hospital admission was 28.7±9.4 minutes in the VL group and 28.9±9.9 minutes in the ML group, with no significant difference (Table 3).
Success rate and complication rate
Comparative results of where tracheal intubation was performed
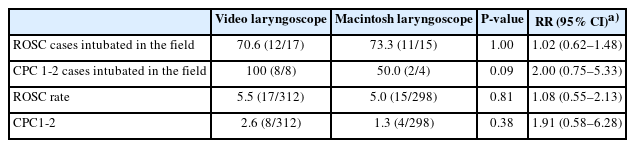
Tracheal intubation was performed in the field significantly more often in the VL group than in the ML group, with percentages of 59.0% (196/332) for the VL group and 49.4% (164/332) for the ML group (RR, 1.19; 95% CI, 1.03–1.37; P=0.010). The success rate of field intubations was 95.0% (186/196) in the VL group and 89.0% (146/164) in the ML group, with a significantly higher proportion in the VL group (RR, 1.07; 95% CI, 1.00–1.14; P=0.040). The success rate after departure from the field was 92.7% (126/136) in the VL group and 90.5% (152/168) in the ML group (RR, 1.02; 95% CI, 0.96–1.10, P=0.050) (Table 3). The percentage of ROSC cases where tracheal intubation was performed in the field was 70.6% (12/17) in the VL group and 73.3% (11/15) in the ML group, with no significant difference between the groups (RR, 1.02; 95% CI, 0.62–1.48; P=1.000). Among the CPC1-2 cases, the percentage of tracheal intubations performed in the field was 100% (8/8) in the VL group and 50.0% (2/4) in the ML group, but this difference was not statistically significant (RR, 2.0; 95% CI, 0.75–5.33; P=0.090) (Table 4).
ROSC rate, CPC1-2
ROSC rate and CPC1-2 results
The percentage of ROSC in all cases involving tracheal intubation was 5.5% (17/312) in the VL group and 5.0% (15/298) in the ML group. There was no significant difference between the groups (RR, 1.08; 95% CI, 0.55–2.13; P=0.810). Similarly, the percentage of CPC1-2 in cases of tracheal intubation was 2.6% (8/312) in the VL group and 1.3% (4/298) in the ML group. Again, there was no significant difference between the two groups (RR, 1.91; 95% CI, 0.58–6.28; P=0.380) (Table 4).
Successful intubation rate and number of intubations performed by each region
The tracheal intubation success rate in Hiroshima Prefecture was 91.9% (610/664). The success rates varied by six regions in Hiroshima Prefecture (HA–HF): 100% (22/22) in HA, 97.6% (80/82) in HB, 93.1% (269/289) in HC, 92.8% (155/167) in HD, 85.7% (78/91) in HE, and 46.2% (6/13) in HF, indicating regional differences. The number of patients intubated per million population was 153 in the HA region, 968 in the HB region, 1,202 in the HC region, 122 in the HD region, 382 in the HE region, and 25 in the HF region. This suggests a disparity in the number of tracheal intubations performed for OHCA across each medical control region. When comparing the success rates between the VL and ML groups, each area either demonstrated the same success rate for both groups or a higher success rate in the VL group (Table 5).

Success rate and number of implementations by region
DISCUSSION
In this study, we conducted a propensity score matching analysis on OHCA data from Hiroshima Prefecture to evaluate the success rate of tracheal intubation and the incidence of esophageal intubation. This analysis suggested the potential benefits of using VLs. Currently, the process for obtaining VL certification in Japan is as follows: The medical control committees initially grant ML certification to individuals who successfully complete 30 cases of tracheal intubation in a hospital setting. Subsequently, they award VL certification to those who successfully complete 5 cases using a VL. Therefore, it is plausible that VLs may have demonstrated a higher success rate than MLs because the individuals performing tracheal intubation with VLs were paramedics with ample experience in performing tracheal intubation with MLs. Conversely, the EMTs who utilized MLs were less experienced in tracheal intubation, which could have contributed to the lower success rate.
Previous studies on tracheal intubation in OHCA patients have reported similar or conflicting results to the present study. Risse et al [10]. Reported on a study conducted on German paramedics and found that there was no significant difference in the success rate comparison between VLs (Glidescope) and direct viewing laryngoscopes (75% and 68.1%, respectively; P=0.63). In addition, in a study conducted among paramedics in the United States, Huebinger et al. [11] found that there was a significant difference in the success rate between VLs (80.8%) and direct viewing laryngoscopes (73.1%) (95% CI, 6.4%–9.0%; P<0.001) and that VL use was not associated with an increased ROSC rate (adjusted odds ratio, 1.0; 95% CI, 0.9–1.1).
In Hiroshima Prefecture, the Ministry of Health, Labor, and Welfare has stated that five successful instances of hospital training are necessary as prerequisite training for VL certification. Furthermore, after obtaining certification, individuals are required to undergo re-training at a hospital every 2 to 3 years. The protocol also designates VLs as the primary device for tracheal intubation. Consequently, many EMTs have gained experience in performing tracheal intubation using VLs. This could potentially explain the higher success rate observed in comparison to previous studies.
The VL simplifies the process of visualizing the larynx and inserting the tube, even during chest compressions. Its monitor feature allows multiple individuals to verify the tube’s placement, which is believed to contribute to the low occurrence of esophageal intubation and the high success rate. Esophageal intubation can be fatal, and in this study, its incidence was significantly lower in the VL group than in the ML group. Timmermann et al. [12]. found that in 149 cases of OHCA where emergency physicians performed tracheal intubation, esophageal intubation was observed in 10 cases (6.7%). Given that esophageal intubation can occur at a certain rate even when a physician performs tracheal intubation in OHCA, it is reasonable to assume that the incidence of esophageal intubation would be higher when EMTs perform tracheal intubation in OHCA.
Currently, there are no specific values or definitions to differentiate between high and low success rates of tracheal intubation for OHCA. The studies conducted by Wang et al. [13] and Benger et al. [14] categorized the success rate of tracheal intubation as low, with rates of 51.6% and 69.8% respectively. Conversely, the study by Jabre et al. [15] deemed the success rate of tracheal intubation as high, with a rate of 97.9%. In this study, the success rate of VL was 94.0%, and that of ML was 89.8%. We propose that both can be classified as having a high success rate for tracheal intubation. The Japan Resuscitation Council Resuscitation Guidelines 2020 also suggest that validation based on regional tracheal intubation success rates, along with the need for uniform definitions, is essential for recommending which advanced airway securing devices should be used. Given that the ROSC and CPC1-2 rates of VLs and MLs are nearly identical, we hope that EMTs will receive certification in video laryngoscopy in the future. This would allow for the preferential use of VLs, given their higher success rate and safety.
The timing of tracheal intubation in cases of OHCA has been a subject of considerable debate. CoSTR2020 emphasizes that not only is the airway maneuver itself crucial, but the timing of this maneuver is also of significant importance. This is supported by observational studies suggesting that delayed advanced airway securement can lead to poor neurological outcomes and decreased survival rates [1].
Kajino et al. [16] and Nakagawa et al. [17,18] have both reported findings related to paramedic tracheal intubation. Kajino et al. [16] found that a delay in this procedure tends to result in a poorer prognosis. Conversely, Nakagawa et al. [17,18] discovered that early tracheal intubation is associated with a more favorable neurological outcome.
In this study, early procedures were performed on approximately 60% of the VL group and 50% of the ML group prior to ambulance admission. In the VL group, the ROSC rate for these early cases was 70.6%, and the CPC1-2 rate was 100%. It was observed that conducting tracheal intubation at the scene before patients were placed in the vehicle increased both the ROSC rate and the CPC1-2 rate. This improvement was attributed to the fact that high-quality chest compressions could be continued with minimal interruption following tracheal intubation.
Furthermore, when comparing the results of tracheal intubation performed in the field, the success rate was 100% for the VL group and 50.0% for the ML group. The higher success rate in the VL group than in the ML group suggests that VLs may be useful.
The success rates for the VL group and the ML group were 94.0% and 89.8%, respectively. However, when examining the success rate and the number of tracheal intubations performed in each region, the success rate of tracheal intubation varied significantly, ranging from 46.2% to 100%. There was a substantial disparity in the number of tracheal intubations per million population performed for OHCA across different regions, with figures ranging from 25 to 1,202. Regions with a particularly low number of intubations performed per million population also had notably low success rates. This significant difference is thought to be influenced by variations in physicians' orders and activity policies, which are determined by the tracheal intubation protocol in each area's Medical Control Committees, even within the same prefecture. Based on the results of tracheal intubation in each region, it is crucial for Medical Control Committees to develop a protocol and discuss a course of action. When comparing VL and ML in each area, the success rate of VL was higher than that of ML in all areas, except for the area where both groups achieved a success rate of 100%. These findings suggest that VLs might potentially be useful.
The rates of ROSC and CPC1-2 in this study were derived from observational studies that utilized Utstein-style data and emergency transport data. However, potential confounding factors may exist in the background of OHCA injuries. This study also has several limitations: it was a retrospective study confined to Hiroshima Prefecture; the proficiency of the EMTs who performed tracheal intubation was not evaluated; and the quality of chest compressions was not assessed.
Our data suggest that VL use offers a slight advantage, as it is associated with a higher success rate and a lower complication rate. Further discussions regarding the preferential use of VLs in OHCA, as well as the development of intubation equipment for emergency medical services, may be warranted. This is to facilitate rapid and safe endotracheal intubation, as suggested by the clinical outcomes of endotracheal intubation in various regions.
Notes
FUNNING
None.
CONFLICT OF INTEREST
No potential conflict of interest relevant to this article was reported.
AUTHORS’ CONTRIBUTIONS
Conceptualization: NS, HU; Methodology: NS, SK; Validation: HT (5th); Formal analysis, Investigation, Data Curation, Visualization, Writing-original draft: NS; Writing-review & editing: TS, HT (6th), HU; Project administration, Supervision: HT (6th); All authors read and approved the final version.
ACKNOWLEDGMENTS
We would like to express our deepest gratitude and appreciation to the people involved in the Hiroshima Prefecture Medical Control committees, the Hiroshima Prefecture Fire Department, and Kokushikan University.