Effect of the floor of residence on survival after out-of-hospital cardiac arrest among high-rise apartment residents in Seoul, Korea
Article information
Abstract
Objective
In urban areas of South Korea, it is common for people to live in apartment (high-rise residential buildings). This study investigated whether individuals living in these apartments face poorer outcomes from out-of-hospital cardiac arrest (OHCA) when they reside on higher floors.
Methods
This retrospective observational study spanned the period from 2013 to 2019 in Seoul and utilized data on OHCA events alongside the South Korean building registry. Apartment floors were categorized into the following ranges: 1, 2–3, 4–5, 6–7, 8–10, 11–15, 16–20, and above 20. Logistic regression analysis was utilized to assess the impact of residing on higher floors on survival outcomes, with the first floor serving as the reference group.
Results
A total of 2,727 cases were included in the analysis. The odds ratio for survival consistently decreased from the 2–3 floor range to the 8–10 floor range when compared to the first floor, reaching statistical significance in the 8–10 floor range (adjusted odds ratio, 0.41; 95% confidence interval, 0.16–0.99). However, beginning with the 11–15 floor range, the odds ratio for survival exhibited an increasing trend, although its statistical significance was diminished.
Conclusion
According to this study, the likelihood of survival for OHCA patients in apartments tended to decrease with rising floor levels up to the 10th floor. However, for residences above the 10th floor, further investigation is needed.
INTRODUCTION
Urbanization is a global trend. As more people live in high-rise buildings within major cities, the height of these structures can create multiple obstacles and delays in the response times of emergency medical services (EMS) [1-4]. This issue is often known as “vertical delay” [5-8]. The potential impact of vertical delay on the treatment outcomes for out-of-hospital cardiac arrest (OHCA) in high-rise buildings has been a significant concern for EMS. Numerous studies have highlighted the possibility of delayed response times and worsened survival outcomes [9-12]. However, many of these studies have either relied on simulations or have primarily compared two broad categories: low-floor and high-floor groups. Only a few real-world studies have demonstrated a correlation between individual floor levels and their respective survival probabilities.
Seoul is one of the most urbanized areas globally, and many of its inhabitants reside in apartments in high-rise residential buildings [13]. This setting provides an ideal environment to study the impact of higher floors on the outcomes of OHCA. However, the typical OHCA data from South Korea do not specify whether the cardiac arrest occurred in an apartment, which poses a challenge for conducting a meaningful analysis.
In this study, we introduce a novel method for identifying the types of buildings where OHCA patients were discovered–namely, cross-referencing building registry data with OHCA incident data. Utilizing this approach, the study aimed to determine whether the survival rates of OHCA patients in Seoul are affected by the floor of the apartments in which they reside.
METHODS
Study setting
Seoul, the capital city of South Korea, has an area of about 605 km² and a population of approximately 9,904,000, yielding a population density of about 16,364 people per km². According to South Korean regulations, an apartment building is defined as a multi-family housing building with five or more floors. Nearly 41% of households in Seoul reside in apartments [2].
As of December 2019, the tallest residential building in Seoul is the Signiel Residences, located within the Lotte World Tower, which reaches a height of 555 m with 123 floors above ground. The Tower Palace G, also known as Samsung Tower Palace, is the second-highest residential building, with 73 floors and reaching a height of 264 m. Following closely, the Mok-dong Hyundai Hyperion holds the third position, with its 69 floors extending to a height of 256 m [14]. However, the majority of high-rise residential buildings range from 5 to 30 floors.
The public EMS system responds to nearly all OHCA patients. In Seoul, the public EMS operates 119 fire stations and a single dispatch center.
Study design and data source
This retrospective observational study utilized OHCA data provided by the Korea Disease Control and Prevention Agency (KDCA) and building register data of the Ministry of Land, Infrastructure and Transport (MOLIT). The observation and analysis of the data in this study were approved by the KCDA [15,16]. This study was approved by the Institutional Review Board (IRB) of the Seoul National University Hospital (IRB No. H-1103-153-357). Informed consent was waived.
The OHCA data from the KDCA are collected by examining the run-sheet data of the EMS and hospital medical records. Researchers trained by the KDCA methodically assessed the run-sheets and hospital records of OHCA patients on a semiannual or quarterly basis, noting the specific floor number where the OHCA took place, provided this information is ascertainable from the records. The definitions used in the dataset followed the Utstein style and the Resuscitation Outcomes Consortium Epistry-Cardiac Arrest [17,18].
The building register data from MOLIT is an open dataset that includes information such as building addresses, types of buildings (e.g., single-family homes, multi-household residential buildings, commercial buildings, etc.), and the total number of floors in each building.
Study population
The selected observation period was from January 1, 2013, to December 31, 2019 (total 7 years). All OHCA cases in Seoul within this timeframe were included. Among the cases, we selected those where the residence met the definition of apartments according to the South Korean construction regulations, specifically referring to multi-household residential buildings with five or more floors. This classification was ascertained by cross-referencing with the building register to ensure that the OHCA incident address corresponded to the defined building type. Instances, where cardiopulmonary resuscitation (CPR) was not attempted due to a do-not-resuscitate order or obvious signs of death, were excluded from the study. Additionally, cases involving cardiac arrest resulting from injury, or those occurring on the road or in an ambulance, were also omitted.
Variables
The independent variable in this study is the number of floors where the OHCA occurred. To examine the effect of higher floors on patient outcomes relative to the first floor, we divided the number of floors into eight categories: the first floor, 2–3 floors, 4–5 floors, 6–7 floors, 8–10 floors, 11–15 floors, 16–20 floors, and >20 floors. All demographic variables of OHCA patients were based on the standard Utstein variables. The response time interval was defined as the period from when the EMS dispatcher received the incoming call to when the ambulance stopped at the location nearest to the patient. To assess the impact of higher floors on EMS responsiveness, the curb-to-AED (automated external defibrillator) time was introduced [7]. This metric represents the time interval between when the ambulance stopped and when the AED analysis began, with the AED automatically recording the start time of the analysis.
Outcomes
The primary outcome of the study was survival to hospital discharge. Good cerebral performance, defined as Cerebral Performance Categories (CPC) 1-2, was considered a secondary outcome.
Statistical analysis
Analysis of variance was used to evaluate the statistical significance of continuous variables, whereas the chi-square test was used for categorical variables. We performed logistic regression to ascertain the impact of higher floors on survival to hospital admission, after adjusting for the standard Utstein variables. The results are presented as odds ratios (ORs) with 95% confidence intervals (CIs). The locally estimated scatterplot smoothing technique was used to visualize trends in outcomes [19]. For statistical analysis and data visualization, we used the statistical and plotting packages of the Julia programming language (version 1.8.5) [20].
RESULTS
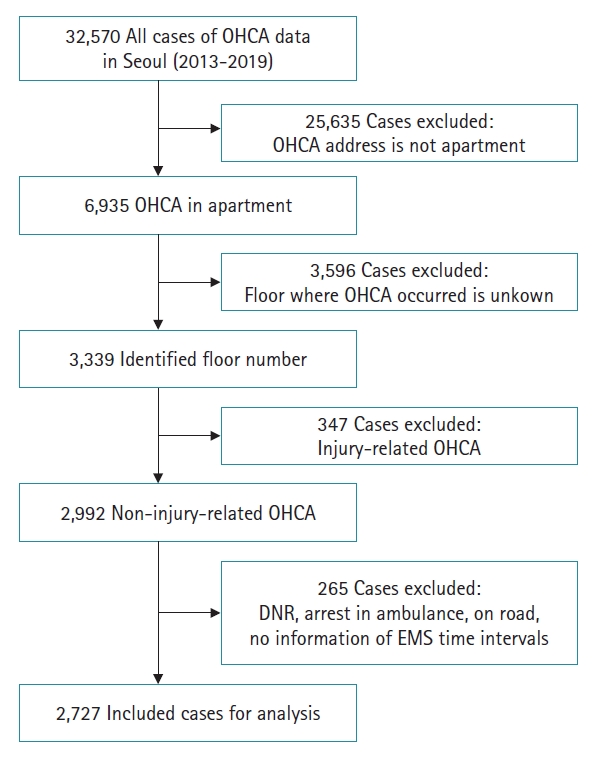
During the study period, 32,570 OHCA cases were recorded. Initially, 6,935 cases in which the OHCA occurred in an apartment were included. After applying the exclusion criteria, the final analysis was conducted on 2,727 cases. The detailed steps of the exclusion process and the corresponding results are presented in Fig. 1.

A flowchart of the detailed exclusion steps and results. OHCA, out-of-hospital cardiac arrest; DNR, do-not-resuscitate order; EMS, emergency medical system.
The demographics are presented in Table 1. Upon categorizing the floors, we observed a significant difference in patient age, with older individuals more frequently residing on floors 6–7 and 8–10 of the apartment buildings. The likelihood of a patient receiving bystander CPR also varied significantly across floor categories, with higher floors seeing more frequent occurrences. In contrast, there were no significant variations in the initial rhythm of the patients or the incidence of the event being witnessed by floor. Response time intervals differed by floor, demonstrating an increasing trend on higher floors. Notably, the time from curb to AED deployment showed a progressive increase with the elevation of the floor level.
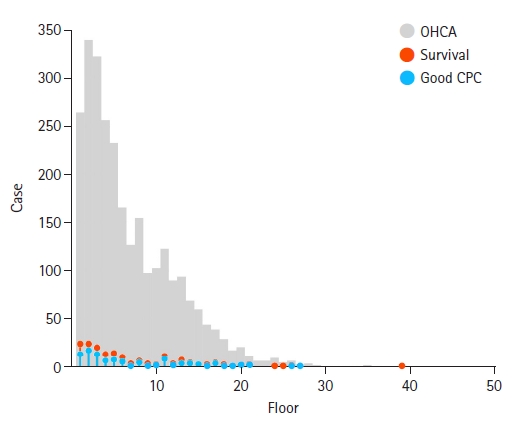
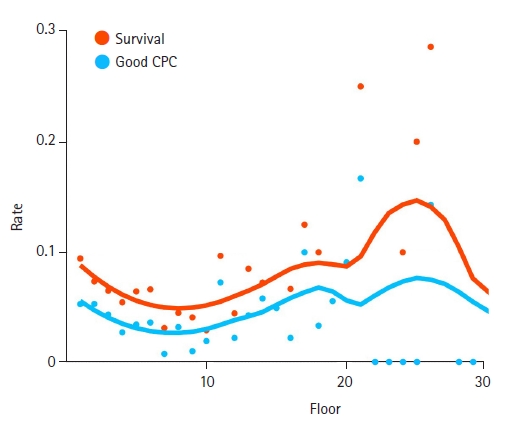
Fig. 2 illustrates the number of OHCA cases for each floor, along with the cumulative results for survival and cases with good cerebral performance status. As shown in the figure, the number of cases above the 20th floor was notably low. Fig. 3 displays the trends in survival rate and good CPC scores by floor. The rates gradually decrease until around the eighth floor and then begin to rise again, continuing up to approximately the 25th floor, forming a U-shaped curve.

Cumulative number of included OHCA cases, survival cases, and patients with good CPC, by each apartment floor. OHCA, out-of-hospital cardiac arrest; Good CPC, Cerebral Performance Category 1–2.

Survival and good CPC rates and trends by each apartment floor (cases above the 30th floor omitted). The locally estimated scatterplot smoothing technique was used to visualize trends in serial outcomes. Good CPC, Cerebral Performance Category 1–2.
Table 2 and Fig. 4 display the ORs of outcomes by floor category, with the first floor serving as the reference point. The OR for survival demonstrated a consistent decrease up to the 8–10 floor range, after which it begins to rise, continuing up to and beyond the 20th floor, thus forming a U-shaped curve. Notably, within the 8–10 floor range, the decrease in the survival OR reached statistical significance (OR, 0.39; 95% CI, 0.19–0.76). However, the level of significance diminished when an adjusted OR was calculated (adjusted OR, 0.49; 95% CI, 0.24–0.98). Similarly, the ORs for a good CPC score followed this U-shaped trend, with statistical significance observed in the 8–10 floor range (OR, 0.41; 95% CI, 0.16–0.99). Nonetheless, the adjusted OR for a good CPC score did not reach statistical significance.
DISCUSSION
Analyzing outcomes of OHCA in high-rise residential buildings presents a significant challenge due to the difficulty in distinguishing between various building types and sizes. The OHCA data from the KDCA includes only the floor information, without specifying the types of buildings, which complicates the ability to conduct a meaningful analysis.
The type of building, such as whether it is an apartment, provides crucial information. In South Korea, residential buildings are primarily categorized into three types: single houses, multi-household low-rise buildings, and apartments. Each category exhibits unique features, such as floor height, the inclusion of elevators, and ambulance accessibility.
In South Korea, apartments are the preferred type of residential housing, often providing better accessibility compared to other options. Single-story or low-rise houses are commonly located on hills or elevated terrains within Seoul, characterized by older, narrow, and winding roads that pose challenges for ambulance access. Consequently, it is crucial to differentiate between building types to conduct a meaningful analysis.
We acknowledged the significance of differentiating between building types, which led us to employ the national building register data from MOLIT. This dataset contains details on the types of buildings, floor heights, and exact addresses. By cross-referencing this information with the OHCA data, which comprises the locations of cardiac arrest incidents, we focused our analysis exclusively on OHCA events that took place in apartment residences.
Our study results showed a statistically significant decrease in survival rates from the 2–3 floor range to the 8–10 floor range. However, the trend reversed starting from the 10th floor upwards. While these results did not reach statistical significance, there is an apparent improvement in survival rates from the 10th floor and above, contradicting the commonly held expectations based on the concept of vertical delay. This U-shaped survival curve aligns with recent findings from a study in Singapore [21], and our study replicates these findings in Seoul.
The underlying cause of the U-shaped survival curve remains uncertain. One proposed explanation is that the size and layout of apartment buildings could affect outcomes. Typically, newer and taller buildings, which are often better designed, tend to have multiple spacious elevators. This can facilitate high-quality CPR and faster transportation of patients. Additionally, construction codes in South Korea require that buildings over 30 stories have a higher number of elevators relative to their size. This may improve the speed of emergency responses and medical interventions, potentially affecting survival rates. This hypothesis aligns with results from an earlier study conducted in Singapore.
Meanwhile, living in ultra-high-rise apartments is a preferred housing option in Seoul and is frequently regarded as a status symbol of affluence. Consequently, the inhabitants of these upscale apartments may be part of a higher socio-economic stratum, enjoying superior health conditions overall. This aspect could significantly mitigate the negative impact on OHCA survival rates associated with higher floors.
However, we do not believe that the results of this study suggest a correlation between residing on the uppermost floors of an apartment building and improved outcomes following OHCA. A significant number of floor data entries were missing from the OHCA dataset, which affected the statistical significance of our findings. Furthermore, the scarcity of OHCA cases above the 20th floor precluded a meaningful sub-group analysis of incidents in ultra-high-rise apartments. This constitutes a limitation of our study.
Furthermore, the results imply that residents of mid-scale apartments, especially those residing on higher floors, are disproportionately affected by vertical delay issues. This is primarily because these buildings typically have fewer elevators than larger-scale apartment complexes. The results underscore the need for more nuanced regulations or guidelines regarding the number of elevators, with a particular focus on mid-scale residential buildings.
In conclusion, our study underscores the finding that as apartment floor levels rise, outcomes for OHCA worsen. This effect is most pronounced up to the 8–10 floor range. Therefore, it is imperative for high-rise apartment buildings to be adequately equipped for OHCA emergencies, with particular attention to their height and scale.
Notes
FUNNING
None.
CONFLICT OF INTEREST
No potential conflict of interest relevant to this article was reported.
AUTHORS’ CONTRIBUTIONS
Conceptualization: YJP, KJS; Data curation: YJP; Formal analysis: YJP; Investigation: all authors; Methodology: YJP, KJH; Supervision: KJS; Validation: KJS, KJH; Visualization: YJP; Writing–original draft: YJP; Writing–review & editing: all authors.


