


INTRODUCTION
The Rugby World Cup, Olympics, and Paralympics were recently hosted in Japan as large-scale sporting events. The Tokyo 2020 Summer Olympics involved 11,420 athletes and 312,883 officials from 206 countries [1], while the 2019 Rugby World Cup attracted 1,704,443 spectators, averaging 37,877 spectators per game [2]. These large-scale sporting events are viewed as mass gatherings with a potential for injuries and illnesses [3]. Therefore, stadium emergency medical systems must be prepared to handle not only athletes, but also spectators and officials [4]. To establish an adequate emergency medical system, it is crucial to understand the patterns of injuries and illnesses that occur among athletes and spectators.
Kiyohara et al. [5] reported on sports-related emergency transports that took place in Osaka over the past 3 years. Out of the 2,642 transports, 701 (25.5%) were due to fractures/bone contusions, making them the most common, followed by 667 (24.2%) cases of bruises. Hirschhorn et al. [6] analyzed sports injuries requiring emergency transport among high school and college students across the United States. Of the 485 case visits, 82 (16.9%) were fractures, the most common injury, followed by 73 (15.1%) concussions. There are numerous reports of sports injuries both in Japan and globally, where athletes were injured during competition and required emergency transport [6].
Conversely, Tajima et al. [4] conducted a study focusing on spectators, finding that 15.8% of spectators who were rushed to the hospital during the tournament suffered from heat stroke and fractures and/or dislocations respectively. The highest incidence was among men in their 70s, followed by men in their 80s [2]. Additionally, the most frequent transport time was just before the start of the game [2]. However, to develop an emergency medical system that includes spectators, it is necessary to have epidemiological information not only for a specific period but also for the entire year. Moreover, Tajima et al. [2] did not report on the locations of injuries and illnesses. Therefore, to build an emergency medical system that includes not only athletes but also spectators and related parties, it is necessary to understand the detailed characteristics of emergency patients throughout the entire sports stadium.
METHODS
Study design
This cross-sectional study utilized national emergency transport data collected between January 1, 2015, and December 31, 2019. The Ethics Committee of the Kokushikan University approved the study (approval number 23003).
Study setting
In 2021, Japan, which spans an area of 378,000 km2 and comprises 47 prefectures, had a population of approximately 125 million. The country's emergency medical services (EMS) are provided around the clock by fire departments. In response to an emergency call, the closest EMS unit is dispatched, with each ambulance manned by three emergency medical technicians. At least one of these technicians is an emergency life support technician, capable of performing advanced life support. In 2022, there were 6,193,581 EMS dispatches, with a national average of 9.4 minutes from the time of the call to the arrival of the EMS, and 42.8 minutes from the call to hospital admission [7].
In Japan, large-scale sports events are coordinated by organizing committees, with the medical committee overseeing the medical aspects. The emergency medical system involves professionals such as physicians, nurses, emergency medical technicians, athletic trainers, and volunteers [8]. The system ensures the availability of nearby medical facilities and the presence of medical professionals, including physicians and nurses, at the sports venue. This is achieved by establishing medical stations, which form the backbone of the medical care system. For every 10,000 spectators, it is recommended to have one physician and two nurses on site [9]. Subsequently, the on-site response prioritizes sports volunteers, with a particular emphasis on emergency medical technicians. These individuals, trained as sports first responders, receive specific education that enables them to perform basic life support, use automated external defibrillators (AEDs), and provide first aid. The number of AEDs installed is generally determined by the size of the sports facility, with at least one unit required and additional units added as needed.
Study data
The Fire and Disaster Management Agency (FDMA) provided emergency transport data for sports grounds, stadiums, and sports facilities from 2015 to 2019. The exclusion criteria were as follows: (1) locations other than athletic fields, stadiums, and various sports facilities; (2) incomplete location details; (3) incidents related to fire, natural disasters, or self-inflicted injuries; (4) transportation to hospitals; (5) missing gender data; and (6) time-variable outliers, defined as instances where the time between the call and patient contact was 30 minutes or more, or the time between the call and hospital admission was 98 minutes or more. Data from the Tokyo Fire Department, Inagi City, and the islands of Tokyo were also excluded due to insufficient and missing data.
Data collection and quality control
The FDMA maintains an emergency transport database, and details about the data collection process have previously been reported [10]. The severity of incidents is categorized as follows: (1) death, which is confirmed at the time of the initial clinical examination; (2) severe, indicating a life-threatening situation such as cardiac or respiratory arrest, or a critical condition that necessitates cardiopulmonary resuscitation; (3) serious, which could potentially be life-threatening; (4) moderate, not life-threatening but requiring hospitalization; and (5) minor, not requiring hospitalization. The initial physician determines the severity upon the patient's arrival at the hospital, using the severity classification table provided by the FDMA [7].
Outcomes
The outcome was categorized as either severe or greater (encompassing death, serious, or severe cases), or as moderate or minor in severity. According to the FDMA definition, cases classified as ŌĆ£death/serious/severeŌĆØ are considered life-threatening, while those labeled as ŌĆ£moderate/minorŌĆØ are deemed non-life-threatening. Classification was conducted based on these categories [7,11]. It is essential to prevent illnesses and injuries associated with life-threatening situations that may arise in sports facilities. Consequently, understanding the characteristics of illnesses and injuries classified as severe or greater is of paramount importance.
Study variables
The variables examined in this study encompassed: (1) the type of incident, which was categorized into sports-related emergency transport incidents (SrETi) and non-SrETi (NSrETi); according to the FDMA's classification of accident types, SrETi was defined as "incidents involving athletes, referees, and other related parties that took place during athletic competitions"; (2) location, which included sports grounds, corridors, stairways, toilets, bathrooms (inclusive of showers and washrooms), gymnasiums, dojos, swimming pools, and other locations; (3) season, divided into spring (March to May), summer (June to August), fall (September to November), and winter (December to February); (4) age group, segmented into children (<12 years old), adolescents and university students (13ŌĆō22 years old), young adults (23ŌĆō35 years old), middle-aged adults (36ŌĆō64 years old), and the elderly (>64 years old); (5) severity, classified as death or serious, severe, and moderate or minor; (6) time of call entry, broken down into morning (6:00ŌĆō11:59), afternoon (12:00ŌĆō17:59), and night (18:00ŌĆō5:59); and (7) the duration from the call-in to patient contact and subsequent arrival at the hospital.
Statistical analysis
Continuous variables were expressed as means and standard deviations, while categorical variables were presented as numbers and percentages. Descriptive statistics were employed to summarize the number of injuries and illnesses based on accident type and severity. To identify factors associated with severity, multivariable logistic regression analyses were utilized to estimate adjusted odds ratios (AORs) and 95% confidence intervals (CI). The independent variables included accident type, season of occurrence, time of emergency call, sex, age, and location of occurrence. Covariates were chosen based on previous studies and clinically significant factors, using the direct entry method [12]. JMP Pro Ver 15.0 (SAS Institute) was the software used for statistical analyses, with the significance level set at 5%.
RESULTS
Between January 1, 2015, and December 31, 2019, a total of 26,710,631 patients were registered in the emergency transport database. Of these, 29,536 patients met the criteria for inclusion in this study. These patients were categorized into two groups: SrETi (n=14,078; 47.7%) and NSrETi (n=15,458; 52.3%), as shown in Fig. 1. The characteristics of these patients are detailed in Table 1. The highest number of incidents occurred during the summer, accounting for 10,550 (35.7%) of the total incidents. Of these, 5,209 (37.0%) were SrETi and 5,341 (34.6%) were NSrETi. The most common time for call entries was between noon and the afternoon, with 15,766 (53.4%) calls. Of these, 7,645 (54.3%) were SrETi, and 8,121 (52.5%) were NSrETi. Males made up the majority of the cases (n=21,096; 71.4%). In the SrETi group, the largest patient demographic (n=6,464; 45.9%) was between 13 and 22 years old. In contrast, the NSrETi group had the highest number of patients (n=5,311; 34.4%) who were over 64 years old. For SrETi incidents, the most common location was the sports ground (n=8,164; 58.0%), followed by the gymnasium and dojo (n=4,110; 29.2%). Similarly, 4,415 (28.6%) of NSrETi incidents occurred on sports grounds, and 2,788 (18.0%) took place in gymnasiums and dojos. However, unlike the SrETi group, NSrETi incidents also occurred in corridors (n=881; 5.7%), on stairways (n=222; 1.4%), in toilets (n=172; 1.1%), and in bathrooms (n=557; 3.6%). The NSrETi group had more severe cases, including 92 deaths (0.6%) and 17 serious illnesses (0.1%), compared to the SrETi group, which had nine deaths (0.06%) and four serious illnesses (0.03%).
In the SrETi group, there were 71 instances of severe or greater illnesses and injuries, while the NSrETi group had 621 such cases. Conversely, SrETi reported 2,429 cases of moderate or minor illnesses and injuries, and NSrETi reported 4,084 cases (Figs. 2, 3). Due to missing values in the disease and injury data from FDMA, percentages were calculated based on the total patient count. Table 2 provides a summary of the characteristics of SrETi and NSrETi where the initial physician rated the severity as severe or greater. In this context, SrETi accounted for 326 cases (24.8%), and NSrETi accounted for 991 cases (75.2%). The most common severe or greater illnesses and injuries in SrETi and NSrETi were non-union fractures (35.2%) and brain diseases (45.6%), respectively. On the other hand, the most common moderate or minor illnesses and injuries in SrETi and NSrETi were bruises (39.2%) and brain diseases (16.1%), respectively.
The results of the multivariable logistic regression analysis are displayed in Table 3. NSrETi were found to be significantly associated with severity (AOR, 1.52; 95% CI, 1.29ŌĆō1.76) when compared to SrETi. Patients who were less than 13 years old (AOR, 0.10; 95% CI, 0.07ŌĆō0.14), between 13 and 22 years old (AOR, 0.20; 95% CI, 0.17ŌĆō0.25), between 23 and 35 years old (AOR, 0.36; 95% CI, 0.29ŌĆō0.44), and between 36 and 64 years old (AOR, 0.75; 95% CI, 0.65ŌĆō0.87) were significantly more associated with severity than patients who were older than 64 years. The locations of a toilet (AOR, 1.84; 95% CI, 1.09ŌĆō3.12), swimming pool (AOR, 3.67; 95% CI, 2.83ŌĆō4.77), and other unspecified locations (AOR, 1.26; 95% CI 1.08ŌĆō1.46) were also significantly associated with severity when compared to the sports ground.
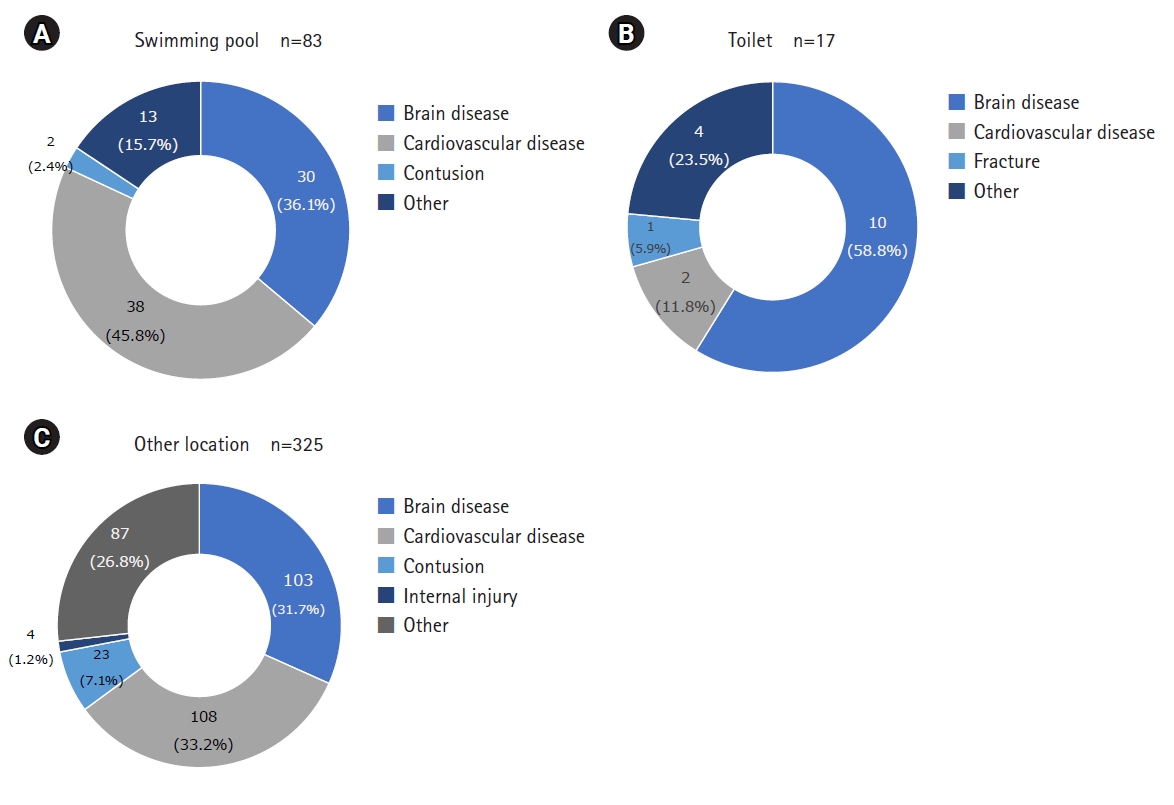
Multivariable logistic regression analysis demonstrated a significantly higher occurrence of severe or greater illnesses and injuries in toilets, swimming pools, and other locations. Fig. 4 illustrates the proportion of NSrETi cases in these places. In swimming pools, cardiac disease accounted for the greatest number of cases (n=38; 45.8%), followed by brain disease (n=30; 36.1%). Similarly, in other locations, cardiac disease was the most common cause of incidents (n=108; 33.2%), followed by brain disease (n=103; 31.7%). In toilets, brain disease was the most common cause of incidents (n=10; 58.8%), followed by cardiac disease (n=2; 11.8%).
DISCUSSION
To the best of our knowledge, this is the first study to examine the characteristics of patients transported from sports stadiums and facilities using FDMA emergency transport data. The results indicated that SrETi patients were more frequently rushed to the hospital due to injuries, while NSrETi patients were more often transported due to illnesses. Moreover, SrETi cases were primarily classified as moderate or minor, and not directly life-threatening. In contrast, NSrETi cases encompassed more severe and potentially life-threatening illnesses, which were more common in swimming pools, toilets, and other locations. The epidemiology of diseases occurring at athletic fields and sports facilities, as identified by this study, could enhance the prognosis of injured and ill patients when athletic trainers, physicians, and EMS are actively providing emergency medical care.
The findings of this study suggest that serious emergency medical incidents at athletic fields and stadiums are more frequently non-sports-related than sports-related. Traditionally, sports-related emergency medical systems and AED placement have been viewed as relief strategies primarily for athletes [13]. However, in line with the suggestions made by Borjesson et al. [14], the results of our study underscore the necessity for emergency medical systems that cater to non-athletes, including staff and spectators, at large-scale sporting events. Besides injuries, illnesses are also prevalent among spectators. Given that spectators are typically older than athletes and are more likely to have complex medical histories, they are at a heightened risk. As evidenced by the Tokyo 2020 Olympics, first aid preparedness in athletic stadiums and sports facilities should account for both injuries among competitors and non-sports participants.
This study found that the incidence of NSrETi was significantly higher in toilets and other locations. The elevated incidence in toilets is thought to be due to the rapid rise in blood pressure that occurs during straining for urination and defecation, which can trigger acute coronary syndrome and subarachnoid hemorrhage [15]. Out-of-hospital cardiac arrests (OHCA) that occur in toilets often result in delayed patient discovery, leading to a poorer neurological prognosis [16]. An increased incidence was also observed in spectator seating areas. The rate of OHCA rose during sports viewing [17-21], and the emotional stress experienced while watching sports can precipitate acute cardiovascular events [22-26]. The findings of this study underscore the importance of promoting awareness of relief in toilets and spectator seating areas. Furthermore, AEDs should be strategically positioned in locations that are easily accessible from toilets and spectator seating areas.
Furthermore, the results of this study revealed that the incidence of severe disease significantly increased with age. As most cases of heart disease (n=108; 33.2%) were classified as severe and occurred in various locations, it is crucial to consider the rising number of spectators with age-related heart disease.
This study had several limitations. First, as an observational study utilizing secondary emergency transport data, there may have been confounding effects. Second, the cross-sectional nature of the study precludes the identification of causal relationships. Third, the study's generalizability to other countries and regions may be limited, given that it was conducted using emergency transport data from Japan. Fourth, the FDMA defines accidents resulting from athletic events as "accidents that occur during the conduct of athletic events and that involve the direct conduct of athletic events, referees, and related personnel" [7]. As such, some non-athletes were included in the SrETi group.
In conclusion, this study investigated the characteristics of patients requiring emergency transport from athletic stadiums and sports facilities in Japan and found that the SrETi group mostly involved moderate and minor non-life-threatening sports injuries. In contrast, the NSrETi group tended to include life-threatening illnesses and injuries, many of which occurred in swimming pools, toilets, or other locations. These results underscore the importance of developing emergency medical systems not only for athletes but also for staff and spectators, as well as strategic AED placement near toilets and spectator seating.