Trends in pre-hospital emergency calls and transportation data for emergency medical services in Thailand
Article information

Abstract
Objective
Emergency medical dispatchers (EMDs) ensure that pre-hospital resources are provided for potential hospital admissions. This analysis aimed to describe the prevalence and time trends of all requests to emergency medical services (EMS) in Thailand.
Methods
This cross-sectional analytical study was conducted using a data set of 8,182,724 emergency calls to emergency medical dispatch centers throughout Thailand, collected from the EMS Registry from January 1, 2016 to December 31, 2020.
Results
Out of the 8,116,969 eligible emergency calls, most regional emergency calls came from the Northeast region (45.5%), while the lowest number of calls came from the Western region (4.6%). The provinces with the highest and lowest numbers of emergency calls were Khon Kaen (6.15%) and Mae Hong Son (0.24%), respectively. The most frequent emergency calls were related to traffic accidents (25.6%), followed by unknown problems (20.4%), abdominal pain (10.6%), fall injury (8%), and dyspnea (7.8%). The total number of calls peaked at rainy season (42.2%), Fridays (14.7%), and during the afternoon (36.5%). Furthermore, 87% of calls were assigned the highest emergency priority levels (EPLs I and II). EPL I cases included cardiac arrest (93.9%), near-drowning (66.9%), unconsciousness (53.9%), stroke (52.7%), and diabetic problems (51.3%). Calls for cardiac arrest peaked in the morning (7:00 to 9:00) and during the evening (16:00 to 19:00), mainly occurring on Monday, in the winter season, and from October to December.
Conclusion
The findings of this study provide fundamental information for the development of strategic treatment planning and allocation of emergency resources in Thailand.
INTRODUCTION
A medical emergency call to access pre-hospital emergency medical services (PEMS) is important for the initial activation of care and ambulance services. Emergency medical dispatch centers (EMDCs) handle and prioritize emergency calls based on information from the callers and allocate the limited pre-hospital resources accordingly [1,2]. Emergency medical dispatchers (EMDs) also serve as the pre-arrival instructor of cardiopulmonary resuscitation (CPR) and guide callers in performing first aid through the telephone until the ambulance service staff arrive [3,4]. Therefore, EMDs serve an important function as gatekeepers in the provision of pre-hospital emergency care and management of potential hospital admissions [1].
Ambulance services are intended for those with life-threatening or serious medical illness or injury [5]. However, over time, these have been increasingly used for non-urgent and even social reasons. Thus, in natural disasters or emergencies, the capacity of these services is limited and even contribute to adverse outcomes and preventable deaths [6]. There is an increasing demand for pre-hospital emergency care and ambulance services [7]. This highlights the significance of organizational planning of emergency medical services (EMS), including ambulance services and EMDCs, as well as the importance of the gatekeeper role of EMDs [8]. Unfortunately, emergency patients’ first contact with the system and the result of the first verbal interrogation in a nonvisual environment has not yet been described in detail, and modifiable factors in emergency patients’ trajectory have rarely been explored [1]. The number of validated indicators is limited, mainly focusing on specific pathologies, but not on system-wide process evaluation [8]. Little is known about the epidemiology and evolution of a European PEMS over more than 10 years, and only limited data on specific medical topics or only some parts of the system have been investigated [9,10]. Thus, there is great medical, policy, and public health interest to analyze the activity and trends of the whole concept of PEMS, especially regarding the emergency call center, the responses of the pre-hospital emergency ambulances and physicians, and the admission of patients into the hospital emergency network [9].
The current study aimed to describe the trend of pre-hospital emergency calls and transportation data for EMS in Thailand.
METHODS
Study design and population
This nationwide, cross-sectional study was performed using a database of 25 Criteria Base Dispatching (CBD) services by the EMS system of Thailand. The data from a 5-year study period (January 1, 2016 to December 31, 2020) was retrospectively analyzed. The study was approved by the Institutional Review Board of the Navamindradhiraj University (#COE001/2565).
Thailand has a total land area of 517,646 km [11] and a total population of 66 million [12]. It is divided into 6 regions (Northern, Southern, Eastern, Western, Central, and Northeastern), consisting of 77 provinces. In case of an emergency, there is a single emergency number (1,669) for the dispatch center, where requests for ambulance transportation to the hospital and support from an emergency medical team are forwarded. The dispatcher follows a decision-making process based on an emergency medical triage protocol and CBD [13], which is a validated tool for managing emergency calls for emergency cases. The Thai EMS system has been under development since 1989 [14]. It is a two-tiered ambulance system consisting of advanced life support and basic care provided by hospital-based ambulances and non-public health sector organizations, respectively [14].
The study used electronically registered data from the EMDC in each province with regards to requests for an ambulance. During such calls, dispatchers are recorded on the computer base linked to the National Institute for Emergency Medicine. The dispatch data contains information following each step of the decision-making process based on the emergency medical triage protocol and CBD in Thailand [10]. Specifically, we investigated the following: (1) causes of EMS calls in the provincial, regional, and emergency priority levels (EPLs) related to life-threatening conditions and trauma emergencies; and (2) temporal variations in terms of hour, time of day, day of the week, month, season, and year.
Data definitions
The time of the emergency calls was defined as the time when the call to 1,669 was received. All events were stratified by the timing of occurrence into the following categories: EPL I (potentially life-threatening), EPL II (acute but not life-threatening), EPL III (not acute but transportation and observation in an ambulance are necessary), and EPL IV (advised and/or recommended referral to the general practitioner). The causes for each call and their corresponding EPL were extracted, especially noting the presence of life-threatening conditions and cause of trauma. For the temporal patterns, we determined 3 seasons: winter (November to February), summer (March to May), and rainy (June to October). The time of day was divided into: night (00:00–5:59), morning (06:00–11:59), afternoon (12:00–17:59), and evening (18:00–23:59). Patients were classified into the following age groups: ≤20, 21–40, 41–60, 61–80, and ≥81 years old. Diurnal pattern variation analysis included the time of day, day of the week, month, season, and year in which emergency calls were made.
Outcome
The outcomes of the study were the most common causes and incidence of emergency calls in the province, region, rate of each EPL, life-threatening conditions, and rate of different causes of trauma. The study also assessed the temporal variability pattern rate by the time of day, diurnal variations, day of the week, month, season, and year.
Statistical analysis
Descriptive analysis was performed by absolute number and percentages for causes and EPLs, life-threatening conditions, and trauma-related causes. We used JMP PRO 15.0 (SAS Institute, Cary, NC, USA) for calculating the adjusted ratio estimates for the associations between the number of calls and the season, day of the week, and time of day during the study period.
RESULTS
Characteristics of emergency calls
A total of 8,182,724 emergency calls were registered during the study period, corresponding to an emergency call incidence of 24 calls: 1,000 people/year (based on 2019 population of Thailand of 66.5 million) [10]. Among these emergency calls, 8,116,969 (99%) had complete provincial and regional data for the causes of emergency calls, and these were considered eligible for the final analysis. The data flowchart is presented in Fig. 1.

Flowchart for data collection process. NIEM, National Institute for Emergency Medicine.
Areas with the most frequent emergency calls
The regions with the highest and lowest numbers of emergency calls were the Northeast (3,797,799 calls, 45%) and Western (386,632 calls, 5%) regions. The top 5 provinces with the highest number of emergency cases were Khon Kaen (6.1%), Nakhon Ratchasima (4.6%), Roi Et (3.7%), Ubon Ratchasima (3.5%), and Mahasakhan (3%). The province with the least number of emergency patients was Mae Hong Son (0.2%). The patient rates of the most common emergency causes reached a ratio of 1:1,000 for each province. The most common causes of emergency calls in the provinces were as follows: unknown problem (74.6%) in Roi Et, traffic accidents (40.9%) in Mahasarakham, and abdominal pain (38.7%), fall injury (23%), headaches (26.6%), and pediatric problems (22.9%) in Khon Kaen (Fig. 2).
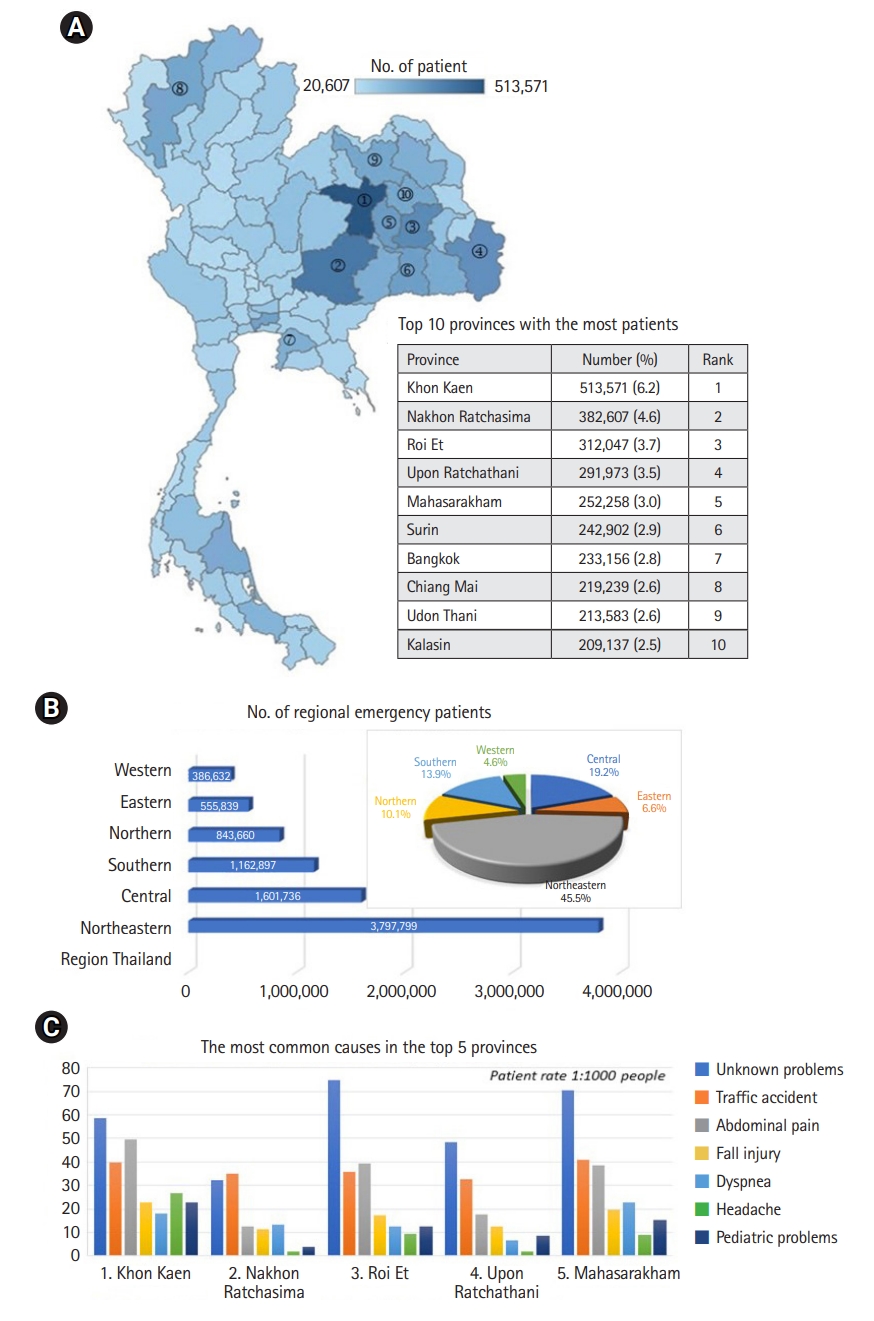
Area with the most frequent emergency calls in Thailand. (A) The highest area for emergency call. (B) Number and percentage of regional emergency patients. (C) Types of most emergency patients in the top 5 provinces.
The annual frequency of emergency calls
The annual frequency of total emergency calls from 2016 to 2020, respectively, was as follows: 1,468,054; 1,533,196; 1,656,139; 1,740,925; and 1,718,725, with a notable increasing trend in emergency calls every year. Similarly, there was an increase in the total number and proportion of (from 1,052 [8.6%] to 4,699 [42.5%]) and emergency environment calls (from 509 [11.6%] to 2,098 [75.7%]).
Causes of EMD contact through emergency calls
The most common recorded causes were categorized as follows: traffic accidents (25.6%), unknown problems (20.4%), abdominal pain (10.6%), fall injury (8%), dyspnea (7.8%), unconsciousness (4.4%), seizure (3.2%), pediatric problems (3.1%), headache (2.8%), chest pain (2.6%), gynecological problems (2%), diabetic problems (1.8%), assault (1.6%), animal bite (0.9%), non-traumatic bleeding (1.3%), stroke (1.1%), psychiatric problems (1%), anaphylaxis (0.7%), drug overdose (0.4%), burn (0.3%), cardiac arrest (0.14%), airway obstruction (0.12%), near-drowning (0.1%), and environment of emergency (0.04%). In addition, male emergency patients accounted for 13% more than females. Regarding the incidence of the disease in each age range, nearly 38.1% of near-drowning situations and 45.8% of traffic accidents occurred among people aged ≤20 years, whereas most cases of gynecological problems (69.7%), psychiatric (48.6%), assault (44.9%), drug overdose (42.3%), environmental emergency (35.9%), and burn (32.4%) occurred among those aged 21–40 years. On the other hand, most cases of non-traumatic bleeding (38.5%), seizure (37%), animal bites (31.6%), abdominal pain (30.9%), and anaphylactic shock (29.7%) occurred among people aged 41–60 years. Lastly, most cases of diabetic problems (54.1%), stroke (45.4%), dyspnea (41%), unknown problems (40.2%), cardiac arrest (39.8%), headaches (38.3%), chest pain (36.5%), airway obstruction (34.1%), and unconsciousness (35.5%) occurred in those aged 61–80 years, while dyspnea (15.1%) occurred most often among those aged ≥81 years. The highest classifications of EPL I and II were assigned in 15.6% and 70.8% of the calls, respectively. EPL I cases involved cardiac arrest (93.9%), near-drowning (66.9%), unconsciousness (53.9%), stroke (52.7%), and diabetic problems (51.3%), while EPL II cases included abdominal pain (89.9%), headaches (86.5%), psychiatric problems (70.1%), animal bites (78.4%), and unknown problems (76.8%) (Fig. 3).
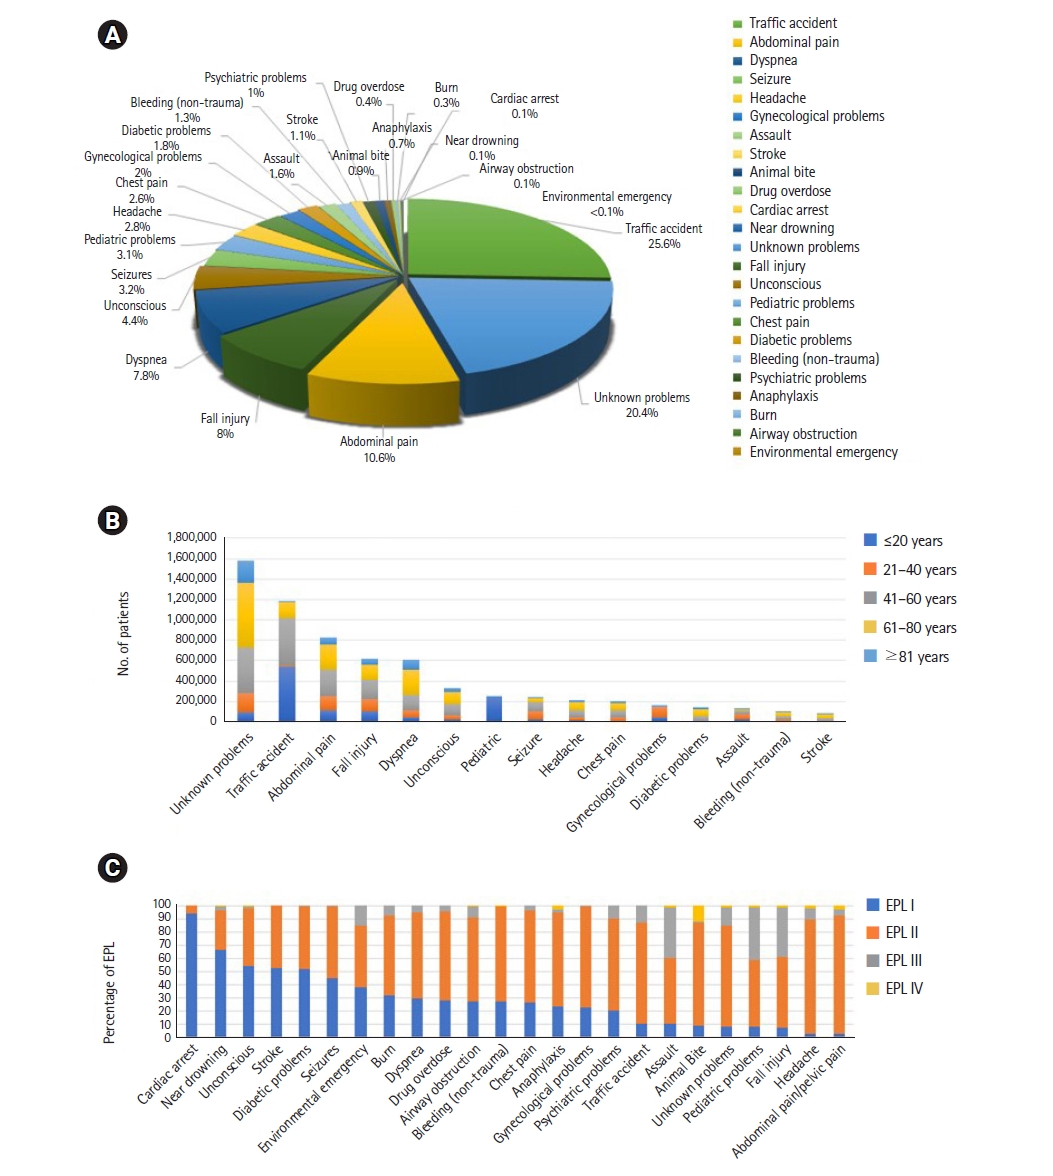
Causes of emergency medical dispatchers contact through emergency calls to clarity by a percentage, age group and emergency priority level (EPL). (A) Causes of emergency calls in Thailand. (B) Causes of emergency calls by age group. (C) Percentage of EPL.
Temporal variations in emergency calls
Table 1 shows the total numbers and percentages of emergency calls overall and stratified by season, day of the week, and time of day according to the EPLs for all calls within the study period. The highest (70.8%) of calls for the EPL II cases were in the rainy and summer seasons, respectively. Most of the calls occurred during weekdays (Fridays) than in weekends. With respect to the time of day, the most and least number of calls were made in the afternoon and during nighttime, respectively.

Total numbers and percentages of emergency calls overall and stratified by season, day of the week, and time of day according to EPLs
Temporal variations for life-threatening causes
Fig. 4 is a graphical illustration of life-threatening conditions caused by non-trauma cases, which we determined by diurnal variation, time of day and years. The figure illustrates different trends for the causes identified. The highest number of calls were made for dyspnea (56.8%), followed by unconsciousness (33.2%), stroke (7.9%), cardiac arrest (1.1%), and airway obstruction (0.9%). Calls made for dyspnea and unconscious patients occurred at 2 peaks (at 10:00 and 19:00–21:00), while calls for stroke peaked in the morning. Calls for life-threatening cases mostly occurred from September to December. Calls for cardiac arrest cases tended to increase every year (1,052 [8.6%] in 2016 vs. 4,699 [42.5%] in 2020), occurring mostly during 2 peaks in the morning (7:00–9:00) and in the evening (16:00–19:00), mainly on Mondays, in the winter season, and from October to December.

Life-threatening calls to clarify diurnal, time of day and year variation. (A) Diurnal and time of day variation. (B) Year variation. The day is divided into four period: night (00:00-5:59), morning (06:00-11:59), afternoon (12:00-17:59), and evening (18:00-23:59).
Temporal variations for trauma-related emergency causes
Fig. 5 is a graphical illustration presenting the diurnal and monthly variations in emergency calls based on trauma emergency causes, including traffic accidents, fall injury, assaults, animal bites, and burn. The figure shows the different occurrences of traffic accidents peaking in during the evening (15:00–20:00). The number of calls was highest in October to December and lowest in March. Calls related to animal bites comprised most of all calls made in May and during the rainy season, whereas assault showed a high percentage in the evening (18:00–24:00), especially in April.
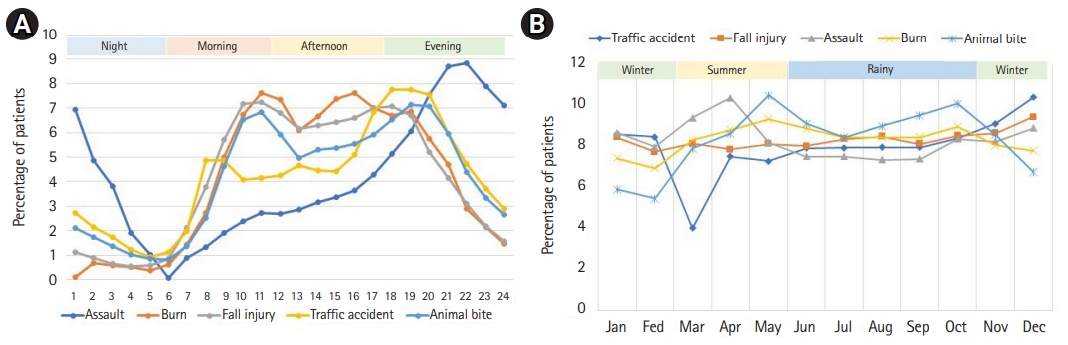
Trauma emergency causes to clarify by diurnal, time of day, monthly and season variation. (A) Diurnal and time of day variation. (B) Monthly and season variation. Seasons are defined as winter (November to February), summer (March to May) and rainy (June to October). The day is divided into four period: night (00:00-5:59), morning (06:00-11:59), afternoon (12:00-17:59), and evening (18:00-23:59).
DISCUSSION
This large, population-based, multisite study of 8,116,969 emergency call events had several important findings. First, there was a 21% increase was in the emergency calls of requests to PEMS between 2016 and 2020 among 77 provinces in Thailand. The overall ratio of requests was 24 calls per 1,000 people for ambulance services, with the highest rate among people aged 41–60 years, and male emergency patients accounting for 13% more than females. Second, the most frequent chief complaints during requests to the PEMS were mostly regarding traffic accidents, unknown problems, abdominal pain, dyspnea, fall injury, and unconsciousness. Third, the most frequent emergency calls occurred during the rainy season, on Fridays, and in the afternoons. Interestingly, the highest number of emergency calls came from traffic accidents among young people aged ≤20 years, with its occurrence peaking in the evening. Fourth, the most common EPL I case was cardiac arrest, most common among people aged 61–80 years, peaking in the morning and early evening as defined by the time the emergency number was called. Furthermore, the highest incidence of cardiac arrest was on Monday, during the winter from October to December. Similarly, other studies have demonstrated a circadian pattern in the incidence of out-of-hospital cardiac arrest (OHCA), with a typical peak in occurrence during the early morning hours and a smaller secondary peak in the early evening. There is also evidence for circadian patterns in the incidence of acute myocardial infarction [15,16].
In accordance with previous studies, these results confirm an increasing rate of PEMS requests and interventions [7]. There was a 39.8% increase in the number of calls to EMDs, with the highest increase observed among patients aged 80–89 years [17]. Most of these calls were made during the day (62% during 7:00–19:00), without any difference according to the day of the week [13]. The most frequent complaint category was an “unclear problem” (19%) [1]. The highest EPLs were assigned in 81% of the calls, and the total number of calls peaked in wintertime (26%), Saturday (16%), and during daytime (39%) [1]. A previous study regarding the demographics of EMS callers found that 55% were women, 50% were in the age range of 70–89 years (with dyspnea, chest pain, and abdominal pain being the most common signs and symptoms), and 13% had a final diagnosis defined as a potentially life-threatening condition [18]. In Osaka, the most frequent symptom was also dyspnea (40.7%) [19].
Our study found that traffic accidents were the most frequent emergency cases, similar to a previous study analysis revealing that 70% of the people injured or killed in traffic crashes are aged 10–39 years. Notably, men are 4 to 5 times higher at risk of death and injury due to traffic crashes than women [20]. Road traffic accidents (RTAs) have emerged as an important public health issue, which needs to be tackled by a multi-disciplinary approach [21]. Human errors contribute significantly to increasing number of road accidents, with 28% of crashes involving males over 15 years being attributable to alcohol intoxication. Furthermore, drunk driving has been responsible for 70% of road fatalities in Mumbai and Delhi, India [21]. The burden of road traffic injuries mostly affected motorcyclists, men (about 80%), and young people (15–34 years) [22]. The contributing factors of RTA included human errors, environmental factors, and vehicular factors, which were identified as definite causes in 70.7%, 12.4%, and 4.5% of accidents, respectively [23]. RTAs have a decreasing trend in developed countries, whereas a higher number of injuries occurs in developing nations [24]. Meanwhile, EMS have been designed to rapidly respond to severe or traumatic medical emergencies and provide life-sustaining care [25]. This is a key performance indicator reflecting the time traffic crash victims wait to be rescued and serving as a measurable quantity for evaluating and managing dispatch operations of EMS vehicles [26].
Similar to previous studies, there are temporal differences in the incidence and survival rates of OHCA. There was significant variability in the frequency of OHCA by the hour of the day, with the highest incidence occurring during the daytime, from Friday to Monday, in December. Survival at hospital discharge was lowest for those that occurred overnight (from 23:01 to 7:00; 7.1%) versus daytime (7:01 to 15:00; 10.8%) or evening (15:01 to 23:00; 11.3%) and spring (11.1%) [27], with changes in potential physiological triggers, including blood pressure and heart rate, vascular tone, heart rate variability, blood viscosity, and platelet aggregation [28,29]. In a previous study, the neurologically intact survival at hospital discharge with dispatcher-assisted CPR (DA-CPR) was 7.0%, while that of bystander-initiated CPR and no bystander CPR were 7.5% and 4.4%, respectively. At one-month neurologically intact survival with DA-CPR, bystander-initiated CPR, and no bystander CPR was 3.1%, 5.7%, and 2.5%, respectively [30]. In recent years, numerous studies worldwide have claimed that DA-CPR is associated with a higher probability of survival, including neurologically intact survival [31,32]. Given this information, there is a clear need to identify the immediate precipitants of trends and temporal variability during the pre-hospital phase, in order to develop preventive strategies and optimize resource planning in an effort to improve emergency patient outcomes. In addition, the health sector should closely coordinate with local authorities in order to jointly promote health, educate, campaign, and create attitudes to prevent common diseases in each province and region. Hopefully, these steps will help in the development of the EMS system and the public health system in Thailand. This study has one limitation, which was unable to clarify the number of emergency calls and temporal variability in the rate during Thailand’s public holidays.
In conclusion, in this large, multi-factorial, population-based study of emergencies, we analyzed temporal differences in the incidence of all emergency calls in terms of season, days of the week, and time of day to identify the trends of EMS workload with respect to time and disease occurrence. This study provides fundamental information for the development of strategic treatment planning and allocation of emergency resources in Thailand. Furthermore, our findings can contribute to the improvement of supportive dispatch priority tools, education training for EMS workers, and the addition of smartphone application technology to ensure timely access and easy location, all of which can improve response time in PEMS.
Notes
Funding
This study was supported by the Graduate school of EMS, Kokushikan University in Japan, Navamindradhiraj University for supporting the scholarship, and Mr. Anurut Somton from the National Institute of Emergency Medicine for the original data support.
Conflict of interest
No potential conflict of interest relevant to this article was reported.
Authors’ contributions
Conceptualization: DT; Data curation: DT; Formal analysis: DT, HTak; Investigation: DT, HTak; Methodology: DT, HTak; Project administration: DT; Resources: DT, HTak; Software: HTak; Supervision: DT; Validation: all authors; Visualization: DT; Writing–original draft: DT; Writing–review & editing: DT, HTan.